2011-2013 Chinese Festive Supplies Export Value Trend
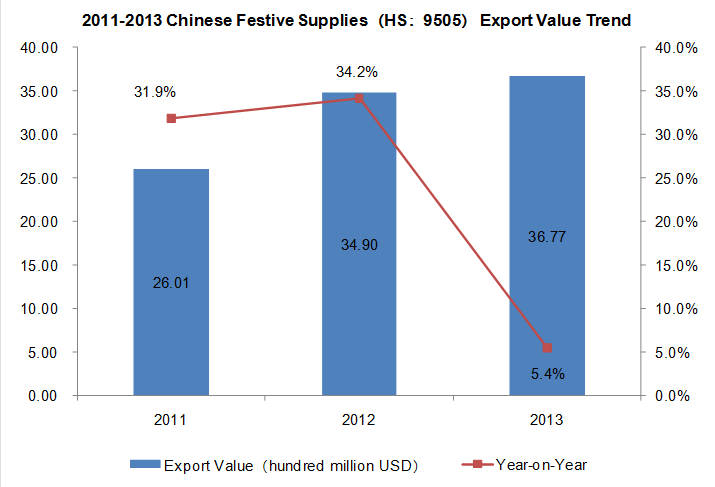
As can be seen from the above chart, the export value of Chinese festive supplies showed an increasing trend year by year. The accumulative export value of 2013 amounted to 3.677 billion dollars, increased 5.4% compared to 2012.
2011-2013 Chinese Festive Supplies Export Market Analysis
| No. | Countries/Regions | Export Value (U.S.dollar) | Exports in 2013 compared with exports in 2011 | ||
| 2011 | 2012 | 2013 | |||
| 1 | USA | 1,087,330,366 | 1,386,412,045 | 1,424,595,627 | 31.02% |
| 2 | United Kingdom | 184,518,084 | 207,207,833 | 248,870,437 | 34.88% |
| 3 | Canada | 103,834,931 | 150,018,643 | 167,544,418 | 61.36% |
| 4 | Netherlands | 124,179,060 | 170,891,275 | 155,820,064 | 25.48% |
| 5 | Germany | 131,334,501 | 148,320,167 | 146,996,273 | 11.93% |
| 6 | Singapore | 13,906,249 | 64,590,597 | 91,764,030 | 559.88% |
| 7 | Brazil | 47,530,105 | 106,500,077 | 88,012,835 | 85.17% |
| 8 | Italy | 87,383,528 | 91,430,464 | 86,975,690 | -0.47% |
| 9 | Russian Federation | 59,313,839 | 73,865,511 | 83,582,596 | 40.92% |
| 10 | Iran | 10,132,301 | 12,831,066 | 71,396,097 | 604.64% |
| 11 | Australia | 36,364,627 | 64,694,824 | 71,055,106 | 95.40% |
| 12 | France | 46,600,640 | 53,195,718 | 69,621,982 | 49.40% |
| 13 | Hong Kong | 34,812,956 | 44,771,185 | 59,073,329 | 69.69% |
| 14 | Malaysia | 14,237,259 | 37,517,205 | 58,715,795 | 312.41% |
| 15 | Mexico | 37,213,848 | 69,166,830 | 57,103,055 | 53.45% |
| 16 | Japan | 42,834,348 | 44,248,857 | 54,638,456 | 27.56% |
| 17 | Panama | 29,672,983 | 57,650,237 | 49,458,729 | 66.68% |
| 18 | Chile | 24,898,612 | 47,125,278 | 46,523,437 | 86.85% |
| 19 | India | 15,056,114 | 25,791,641 | 41,093,925 | 172.94% |
| 20 | Spanish | 48,099,097 | 39,222,019 | 37,661,917 | -21.70% |
The top three export markets of Chinese festive supplies were USA, United Kingdom and Canada. In 2013, the export value to USA,United Kingdom and Canada was 1.425 billion dollars, 0.249 billion dollars and 0.168 billion dollars respectively, which increased 31.02%,34.88% and 61.36% compared to 2011. Among the above twenty export markets, the export value to Iran showed the biggest increase, which increased 604.64% compared to 2011.
2011-2013 Chinese Festive Supplies Export Market Share Analysis
| No. | Countries/Regions | Value Percentage | ||
| 2011 | 2012 | 2013 | ||
| 1 | USA↓ | 41.80% | 39.73% | 38.75% |
| 2 | United Kingdom | 7.09% | 5.94% | 6.77% |
| 3 | Canada↑ | 3.99% | 4.30% | 4.56% |
| 4 | Netherlands | 4.77% | 4.90% | 4.24% |
| 5 | Germany↓ | 5.05% | 4.25% | 4.00% |
| 6 | Singapore↑ | 0.53% | 1.85% | 2.50% |
| 7 | Brazil | 1.83% | 3.05% | 2.39% |
| 8 | Italy↓ | 3.36% | 2.62% | 2.37% |
| 9 | Russian Federation | 2.28% | 2.12% | 2.27% |
| 10 | Iran | 0.39% | 0.37% | 1.94% |
| 11 | Australia↑ | 1.40% | 1.85% | 1.93% |
| 12 | France | 1.79% | 1.52% | 1.89% |
| 13 | Hong Kong | 1.34% | 1.28% | 1.61% |
| 14 | Malaysia↑ | 0.55% | 1.08% | 1.60% |
| 15 | Mexico | 1.43% | 1.98% | 1.55% |
| 16 | Japan | 1.65% | 1.27% | 1.49% |
| 17 | Panama | 1.14% | 1.65% | 1.35% |
| 18 | Chile | 0.96% | 1.35% | 1.27% |
| 19 | India↑ | 0.58% | 0.74% | 1.12% |
| 20 | Spanish↓ | 1.85% | 1.12% | 1.02% |
Note:"↑"represents that the indicators listed continued to increase from 2011 to 2013, "↓"represents that the indicators listed continued to decrease from 2011 to 2013.
According to the data of 2013, USA, United Kingdom and Canada were the top three export market for Chinese festive supplies, which respectively accounted for 38.75%, 6.77% and 4.56% of the total export value of festive supplies in 2013.
Judging from the export market share trend, the countries whose market share continued to grow were Canada, Singapore, Australia, Malaysia and India. While, the countries whose market share dropped continuously were USA, Germany, Italy and Spanish.


