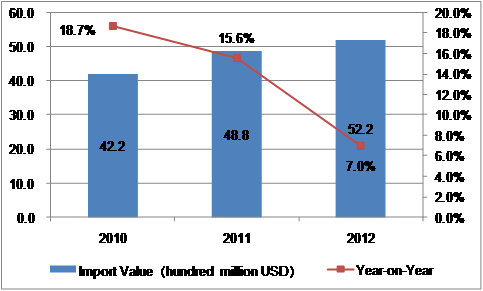
Import Value for Global Artificial Flowers & Wigs(HS: 67)from 2010 to 2012

The total import value for global artificial flowers & wigs from 2010 to 2012 increased year by year. In 2012 it reached 5.22 billion USD, and increased 7.0% year on year.
Major Countries/Regions for Artificial Flowers & Wigs(HS: 67)Import in the First Quarter of 2013
| Countries/Regions | Import Value in the First Quarter of 2013 (thousand USD) | Year on Year |
| USA | 468,170 | 1.2% |
| China | 83,361 | -18.7% |
| Japan | 61,956 | -3.1% |
| Germany | 52,144 | 6.2% |
| United Kingdom | 45,410 | -8.0% |
| France | 38,247 | -8.0% |
| Italy | 27,918 | -18.8% |
| Canada | 24,115 | 5.4% |
| Netherlands | 22,214 | 22.3% |
| Poland | 18,741 | 16.0% |
The major countries/regions for global artificial flowers & wigs import in the first quarter of 2013 were USA, China, Japan, Germany, United Kingdom, France, Italy, Canada, Netherlands and Poland.
Source: UN COMTRADE
Major Countries/Regions for Artificial Flowers & Wigs(HS: 67)Export in the First Quarter of 2013
| Countries/Regions | Export Value in the First Quarter of 2013 (thousand USD) | Year on Year |
| China | 1,120,966 | 28.6% |
| India | 98,415 | 5.2% |
| Germany | 34,120 | -3.5% |
| USA | 26,520 | -3.3% |
| Netherlands | 17,425 | 3.2% |
| Italy | 16,549 | 9.0% |
| Belgium | 12,150 | -28.7% |
| South Korea | 11,803 | -8.8% |
| United Kingdom | 10,681 | 33.3% |
| Philippines | 9,969 | -30.3% |
According to statistics in the first quarter of 2013, with a value of 1.12 billion USD, China ranked first for artificial flowers & wigs export and increased 28.6% year on year. India followed and its export value was 98.415 million USD. Obviously China is more competitive.
Source: UN COMTRADE


