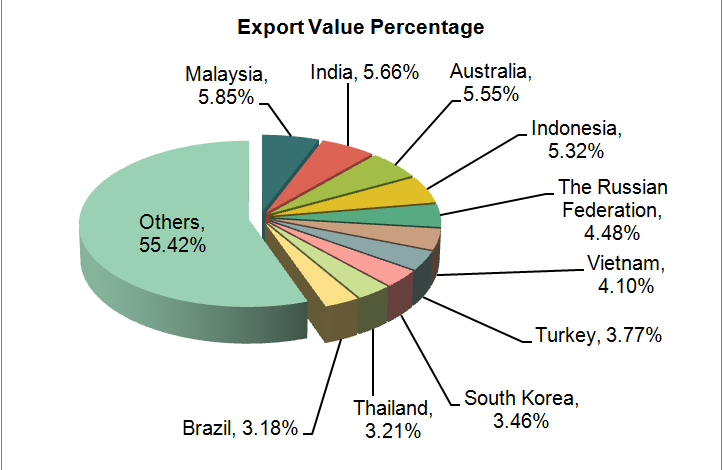
China Handling Machinery (HS:8428) Export Volume and Value and Major Export Countries/Regions from Jan. to September in 2013 (by Export Value)
| No. | Countries/Regions | Jan. to September Total | Total Year on Year | ||
| Volume (Piece) | Value (USD) | Volume | Value | ||
| 1 | Malaysia | 11,730 | 171,688,356 | 8.7% | 62% |
| 2 | India | 11,519 | 166,148,355 | 16.9% | -37.6% |
| 3 | Australia | 59,295 | 163,063,011 | 16.1% | 10.7% |
| 4 | Indonesia | 12,912 | 156,303,101 | 43.3% | 36.3% |
| 5 | The Russian Federation | 25,181 | 131,542,424 | 20.6% | 11.7% |
| 6 | Vietnam | 8,961 | 120,351,870 | -18.7% | 30.9% |
| 7 | Turkey | 33,509 | 110,707,372 | 65.9% | 33.1% |
| 8 | South Korea | 12,272 | 101,622,424 | 15.8% | 58.2% |
| 9 | Thailand | 37,512 | 94,339,725 | 206.3% | 19.9% |
| 10 | Brazil | 31,207 | 93,443,910 | 91.3% | -17.6% |

As seen from the export data of Jan.-September in 2013, our country's handling machinery export value amounted to about 2.937 billion US dollars from Jan. to September in 2013, with an increase of 13.3% year on year. Main export countries/regions are Malaysia, India, Australia, Indonesia, The Russian Federation, Vietnam, Turkey, South Korea, Thailand, and Brazil and so on. Malaysia is China handling machinery's key export market. The export value to Malaysia accounted about 5.85% of the total export value of the product. China handling machinery's main export market is scattered, which mainly concentrated in India, Indonesia, Russia and Malaysia and other neighboring countries.
Source: Customs Information Network


