China Scissors and Similar Articles (HS: 8213) Export Volume and Value from Jan. to June in 2013
| Month | Volume (-) | Value (USD) | Compared to the Same Period of Last Year | |
|
|
|
| Volume | Value |
| January | 6,512,954 | 38,829,562 | -42% | 11.9% |
| February | 4,195,765 | 26,439,478 | 16.5% | 40.1% |
| March | 4,130,746 | 26,503,237 | -45.6% | -10.5% |
| April | 6,428,824 | 36,161,003 | -12.3% | -2.6% |
| May | 7,167,587 | 43,794,439 | -5.4% | 6.1% |
| June | 7,481,301 | 40,779,106 | 6% | -4.8% |
| Jan.-June Total | 35,917,177 | 212,506,825 | -19.1% | 3.9% |
The export value of China scissors and similar articles amounted to 213 million US dollars, with an increase of 3.9% from Jan. to June in 2013.
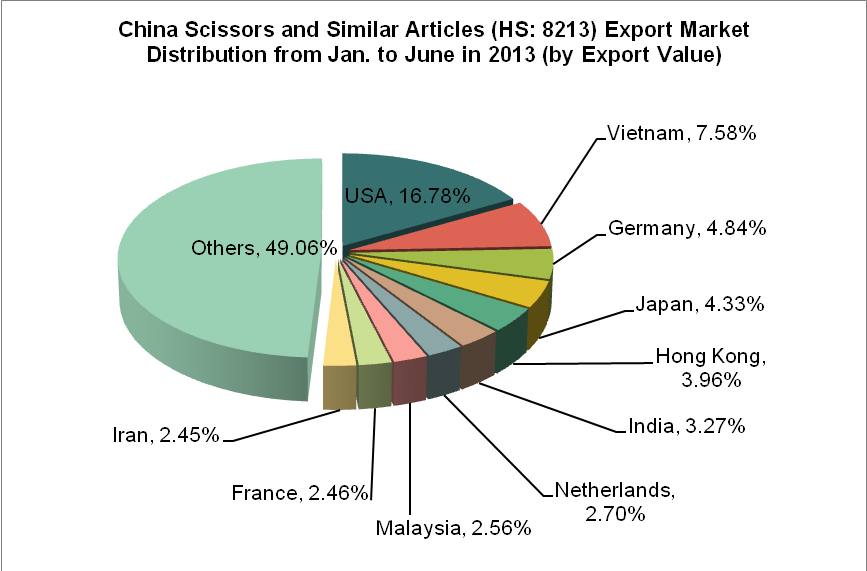
China Scissors and Similar Articles (HS: 8213) Export Countries/Regions Distribution from Jan. to June in 2013
| No. | Countries | Volume (-) | Value (USD) | Compared to the Same Period of Last Year | |
|
|
|
|
| Volume | Value |
| 1 | USA | 4,821,520 | 35,659,292 | -3% | 0.5% |
| 2 | Vietnam | 1,134,961 | 16,105,599 | -20.3% | -18.2% |
| 3 | Germany | 1,339,624 | 10,283,511 | -21.1% | -10.4% |
| 4 | Japan | 1,188,837 | 9,209,867 | -10.8% | 2.9% |
| 5 | Hong Kong | 1,551,398 | 8,419,509 | -35.1% | -2.9% |
| 6 | India | 1,417,460 | 6,952,114 | -22% | 45.8% |
| 7 | Netherlands | 747,404 | 5,744,646 | 7.4% | -15.7% |
| 8 | Malaysia | 1,247,632 | 5,429,740 | -13.9% | 13.7% |
| 9 | France | 670,944 | 5,233,874 | 1.2% | 2.8% |
| 10 | Iran | 1,540,777 | 5,207,603 | 99.3% | 99.2% |

From Jan. to June in 2013, among the top ten export destination countries/regions, the export volume of Iran increased the largest (with an increase of 99.3% year on year), while the export value of Iran also increased the largest (with an increase of 99.2% year on year), followed by India (with an increase of 45.8% year on year).
Source: Customs Information Network


