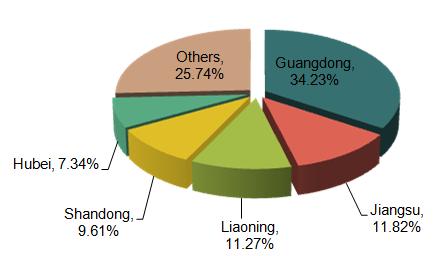
Jan. to Sep. 2014, China Plasma Arc,Water-Jet Cutting Machines (HS: 8456) Export Enterprises Distribution (Sort by Export Value)
| NO. | Original place | Jan. - Sep. | Compared to the same period last year | ||
| Volume | Value(USD) | Volume | Value | ||
| 1 | Guangdong | 47,349 | 144,681,284 | 22.4% | 42.2% |
| 2 | Jiangsu | 9,036 | 49,954,854 | -0.3% | -12.7% |
| 3 | Liaoning | 1,038 | 47,626,263 | 16% | 7.7% |
| 4 | Shandong | 18,830 | 40,628,906 | -9.2% | 21.1% |
| 5 | Hubei | 1,345 | 31,004,816 | 7% | 39.3% |
| 6 | Beijing | 1,519 | 29,543,218 | -15.8% | -35.3% |
| 7 | Shanghai | 17,539 | 27,403,754 | 6.3% | 24.4% |
| 8 | Fujian | 387 | 19,753,326 | -72.2% | 37.6% |
| 9 | Zhejiang | 28,593 | 15,217,276 | 10.2% | 14.2% |
| 10 | Hebei | 2,237 | 5,221,548 | 1.3% | 48.2% |
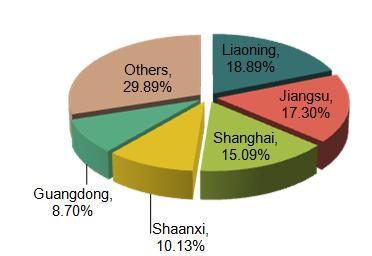
Jan. to Sep. 2014, China Machining Centres, Unit Construction Machines (HS: 8457) Export Enterprises Distribution (Sort by Export Value)
| NO. | Original place | Jan. - Sep. | Compared to the same period last year | ||
| Volume | Value(USD) | Volume | Value | ||
| 1 | Liaoning | 351 | 24,120,420 | -26.1% | 52.5% |
| 2 | Jiangsu | 453 | 22,090,698 | -42.3% | 6.3% |
| 3 | Shanghai | 228 | 19,269,280 | -36% | -25.1% |
| 4 | Shaanxi | 228 | 12,932,603 | 714.3% | 1410.6% |
| 5 | Guangdong | 393 | 11,104,095 | -45.8% | -3% |
| 6 | Zhejiang | 4,581 | 6,729,130 | 22.6% | -40.8% |
| 7 | Shandong | 242 | 6,269,092 | 21.6% | -18.9% |
| 8 | Fujian | 178 | 4,476,849 | 29.9% | 131% |
| 9 | Tianjin | 122 | 3,671,417 | 110.3% | 40.3% |
| 10 | Hunan | 2 | 3,317,803 | -66.7% | 107.4% |
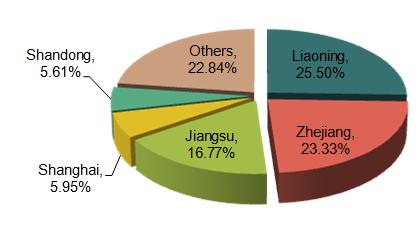
Jan. to Sep. 2014, China Lathes (including Turning Centres) for Removing Metal (HS: 8458) Export Enterprises Distribution (Sort by Export Value)
| NO. | Original place | Jan. - Sep. | Compared to the same period last year | ||
| Volume | Value(USD) | Volume | Value | ||
| 1 | Liaoning | 2,905 | 93,802,376 | 9.6% | 7.9% |
| 2 | Zhejiang | 5,075 | 85,817,568 | 4.9% | 47.4% |
| 3 | Jiangsu | 15,598 | 61,663,557 | -9.5% | 14% |
| 4 | Shanghai | 14,418 | 21,881,507 | 17.5% | -15.9% |
| 5 | Shandong | 2,959 | 20,637,138 | 38.5% | 0.8% |
| 6 | Guangdong | 1,131 | 20,053,452 | -34.3% | -23.6% |
| 7 | Shaanxi | 1,258 | 12,816,688 | -1.6% | -13.5% |
| 8 | Yunnan | 986 | 9,801,867 | -22.1% | -14.6% |
| 9 | Anhui | 5,066 | 9,245,549 | -15.5% | -9.8% |
| 10 | Heilongjiang | 12 | 6,269,343 | -69.2% | 72.9% |
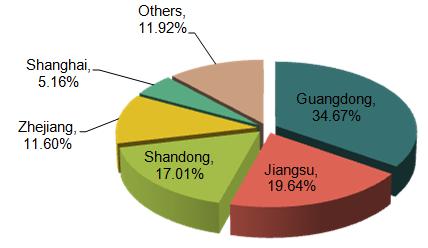
Jan. to Sep. 2014, China Lathes (including Turning Centres) for Removing Metal except Product (HS: 8458) Export Enterprises Distribution (Sort by Export Value)
| NO. | Original place | Jan. - Sep. | Compared to the same period last year | ||
| Volume | Value(USD) | Volume | Value | ||
| 1 | Guangdong | 4,741 | 101,784,471 | 125.9% | 786.1% |
| 2 | Jiangsu | 358,931 | 57,658,379 | 3.9% | 16.1% |
| 3 | Shandong | 172,280 | 49,954,901 | -12.4% | 2.5% |
| 4 | Zhejiang | 139,354 | 34,052,015 | -9.7% | 6.9% |
| 5 | Shanghai | 21,694 | 15,158,240 | 27.1% | 34.1% |
| 6 | Liaoning | 482 | 8,141,131 | 23% | -29.6% |
| 7 | Anhui | 2,544 | 3,621,037 | -2.1% | -27.2% |
| 8 | Hubei | 28,147 | 3,292,204 | -20.2% | -64% |
| 9 | Yunnan | 207 | 3,197,318 | -3.3% | -10.1% |
| 10 | Heilongjiang | 36 | 2,685,045 | 38.5% | 1376.1% |
Jan. to Sep. 2014, China Machine-tools for Deburring (HS: 8460) Export Enterprises Distribution (Sort by Export Value)
| NO. | Original place | Jan. - Sep. | Compared to the same period last year | ||
| Volume | Value(USD) | Volume | Value | ||
| 1 | Jiangsu | 1,093,195 | 48,098,056 | -5.7% | -10.4% |
| 2 | Guangdong | 153,951 | 37,619,586 | 138.8% | 22.4% |
| 3 | Zhejiang | 1,220,393 | 36,430,739 | 27% | 42.8% |
| 4 | Shandong | 484,987 | 34,934,805 | -12.8% | -5.1% |
| 5 | Shanghai | 119,822 | 20,460,666 | -16.1% | -1.7% |
| 6 | Liaoning | 495 | 5,566,284 | 7.1% | 65.9% |
| 7 | Hubei | 87,567 | 2,493,492 | 20.3% | -29.8% |
| 8 | Hebei | 18,660 | 2,283,878 | -12.8% | 27.6% |
| 9 | Henan | 360 | 2,131,551 | 54.5% | 96.4% |
| 10 | Guizhou | 6 | 1,848,262 | 200% | 517620.4% |
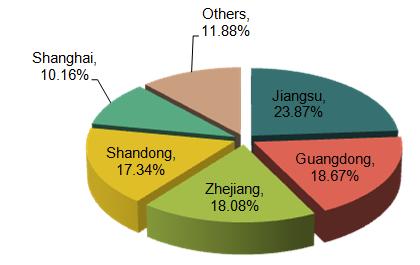
Jan. to Sep. 2014, China Machine-tools for Planning/Shaping (HS: 28) Export Enterprises Distribution (Sort by Export Value)
| NO. | Original place | Jan. - Sep. | Compared to the same period last year | ||
| Volume | Value(USD) | Volume | Value | ||
| 1 | Jiangsu | 495,197 | 54,619,387 | 5.9% | 6.5% |
| 2 | Zhejiang | 645,263 | 42,728,627 | -0.2% | -4.6% |
| 3 | Guangdong | 58,903 | 39,106,887 | 254.3% | 340.2% |
| 4 | Shanghai | 346,142 | 32,483,023 | -2.5% | 8% |
| 5 | Shandong | 34,757 | 19,261,073 | 18.8% | 38.1% |
| 6 | Tianjin | 414 | 4,704,837 | 43.3% | 147.2% |
| 7 | Liaoning | 12,375 | 3,951,322 | 46.5% | 116.3% |
| 8 | Henan | 2,512 | 2,503,386 | 46.5% | 99.9% |
| 9 | Sichuan | 2,100 | 2,423,536 | 17.3% | -1.7% |
| 10 | Beijing | 1,503 | 2,149,873 | 62% | -2% |
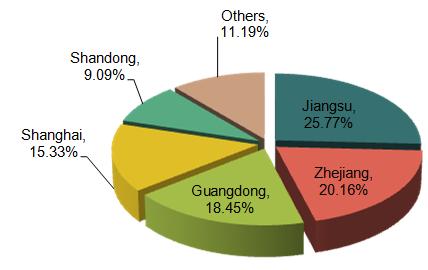
Jan. to Sep. 2014, China Machine-tools for Working Metal by Forging, Die-stamping (HS: 8462) Export Enterprises Distribution (Sort by Export Value)
| NO. | Original place | Jan. - Sep. | Compared to the same period last year | ||
| Volume | Value(USD) | Volume | Value | ||
| 1 | Jiangsu | 58,360 | 195,350,600 | 47.1% | 5.6% |
| 2 | Guangdong | 12,820 | 149,547,979 | 125% | 135.3% |
| 3 | Zhejiang | 141,132 | 68,558,191 | 41.5% | -21.8% |
| 4 | Shandong | 124,923 | 58,218,417 | 36.1% | -38.8% |
| 5 | Tianjin | 664 | 43,666,111 | 49.2% | 37.6% |
| 6 | Shanghai | 29,578 | 42,638,804 | 20% | 25.5% |
| 7 | Hubei | 886 | 23,956,851 | 2.9% | -0.7% |
| 8 | Anhui | 1,832 | 20,201,132 | 36.5% | 7.6% |
| 9 | Liaoning | 557 | 13,263,308 | 190.1% | 79.8% |
| 10 | Hebei | 1,354 | 10,335,255 | 83% | 0.7% |
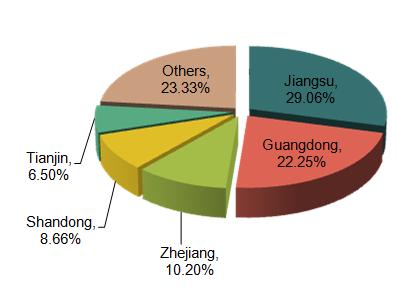
Jan. to Sep. 2014, China Machine-tools for Metal or Cermets, without Removing Material (HS: 8463) Export Enterprises Distribution (Sort by Export Value)
| NO. | Original place | Jan. - Sep. | Compared to the same period last year | ||
| Volume | Value(USD) | Volume | Value | ||
| 1 | Jiangsu | 2,448 | 43,439,533 | -5.3% | 21.8% |
| 2 | Guangdong | 2,235 | 35,277,016 | 51.1% | 52.9% |
| 3 | Zhejiang | 5,857 | 26,969,296 | 21.3% | 12.6% |
| 4 | Hebei | 1,047 | 12,760,265 | 7.1% | 13.2% |
| 5 | Shanghai | 866 | 12,439,793 | -31.2% | 8.2% |
| 6 | Shandong | 831 | 3,968,422 | -34.8% | -35.9% |
| 7 | Fujian | 142 | 3,067,446 | 22.4% | 13.5% |
| 8 | Liaoning | 117 | 2,610,134 | -2.5% | -7.7% |
| 9 | Tianjin | 260 | 2,554,181 | -35% | -40.1% |
| 10 | Beijing | 313 | 2,093,816 | 36.1% | 53.1% |
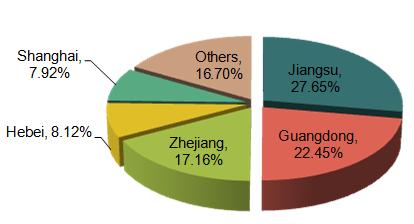
Jan. to Sep. 2014, China Machine-tools for Ceramics and Mineral Materials (HS: 8464) Export Enterprises Distribution (Sort by Export Value)
| NO. | Original place | Jan. - Sep. | Compared to the same period last year | ||
| Volume | Value(USD) | Volume | Value | ||
| 1 | Guangdong | 146,063 | 173,644,993 | -6.7% | -15.3% |
| 2 | Fujian | 17,180 | 60,700,274 | 69.3% | 5.2% |
| 3 | Jiangsu | 770,978 | 53,061,916 | 8.3% | 8.4% |
| 4 | Zhejiang | 1,447,529 | 41,913,492 | -11.2% | -6.7% |
| 5 | Shandong | 17,540 | 29,668,542 | -18.7% | -31.5% |
| 6 | Shanghai | 36,104 | 17,175,740 | -5.4% | -24.2% |
| 7 | Beijing | 2,537 | 11,662,476 | 136.4% | 83.1% |
| 8 | Liaoning | 854 | 4,615,781 | -63.3% | -28.9% |
| 9 | Hebei | 11,074 | 2,959,093 | 35.7% | 19.6% |
| 10 | Henan | 249 | 2,730,460 | -61.1% | 252.3% |
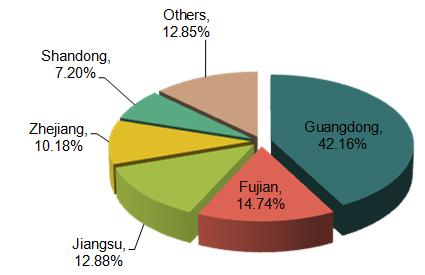
Jan. to Sep. 2014, China Machine-tools for Working Wood, Hard Rubber and Hard Plastics (HS: 8465) Export Enterprises Distribution (Sort by Export Value)
| NO. | Original place | Jan. - Sep. | Compared to the same period last year | ||
| Volume | Value(USD) | Volume | Value | ||
| 1 | Guangdong | 401,400 | 477,391,396 | 49.2% | 475% |
| 2 | Jiangsu | 1,628,096 | 217,257,827 | 20.7% | 27.4% |
| 3 | Shandong | 911,885 | 216,311,244 | 25.4% | 50.2% |
| 4 | Zhejiang | 1,716,037 | 177,112,389 | 14.7% | 10.9% |
| 5 | Fujian | 172,691 | 28,963,381 | 16.9% | 45.2% |
| 6 | Shanghai | 52,745 | 20,604,661 | 175.2% | 81.8% |
| 7 | Hebei | 1,256 | 16,328,803 | 58.8% | 291.5% |
| 8 | Anhui | 539 | 12,895,777 | 349.2% | 16081.4% |
| 9 | Liaoning | 2,050 | 5,503,108 | 144.3% | 58.6% |
| 10 | Jiangxi | 223 | 3,161,140 | 159.3% | 255.6% |
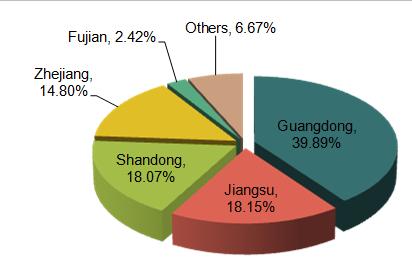
Jan. to Sep. 2014, China Machinery Parts & Accessories (HS: 8466) Export Enterprises Distribution (Sort by Export Value)
| NO. | Original place | Jan. - Sep. | Compared to the same period last year | ||
| Volume | Value(USD) | Volume | Value | ||
| 1 | Jiangsu | 37,430,787 | 147,043,161 | 8.4% | 11.4% |
| 2 | Liaoning | 72,973,082 | 142,517,176 | 77.7% | 74.5% |
| 3 | Shandong | 34,767,916 | 110,402,699 | 10.5% | 18.8% |
| 4 | Shanghai | 25,781,566 | 104,862,082 | 23.3% | 6.6% |
| 5 | Zhejiang | 27,972,243 | 84,440,653 | 13.2% | 8.9% |
| 6 | Guangdong | 11,962,167 | 75,268,526 | 6.3% | 5.9% |
| 7 | Tianjin | 22,673,466 | 35,531,335 | 27.6% | 12.8% |
| 8 | Hebei | 17,961,559 | 31,355,927 | 65.9% | 40.3% |
| 9 | Beijing | 3,223,213 | 19,109,692 | -19.2% | 18.1% |
| 10 | Henan | 8,149,976 | 16,765,582 | 74.3% | 84.2% |
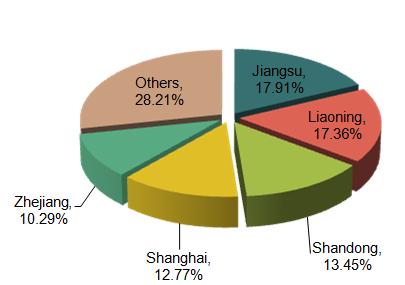
According to the export data from January to September in 2014, China's main original export places of Machine-tools ‘accessories are Jiangsu, Liaoning and Shandong province. The export amount of Jiangsu and Liaoning province accounted for 17.91%, 17.36% of the total amount in our country.
Data from: The customs information network


