2011-2013 Malaysian Electric Wire and Cable Import Value Annual Trend
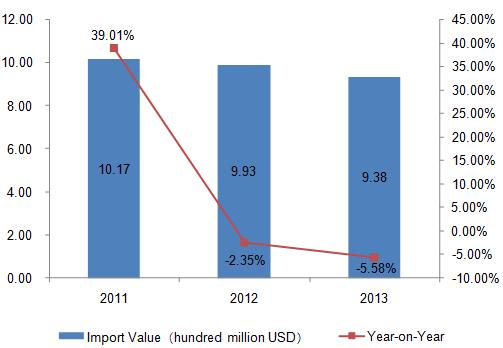
From 2011 to 2013, the import value of electric wire and cable for Malaysia declined year by year. The total import value of 2013 for Malaysia was approximately 0.938 billion dollars, declined 5.58% compared to the same period of 2012.
2011-2013 Malaysian Electric Wire and Cable Import Market Analysis
| No. | Import Countries / Regions | Import Value(Thousand Dollars) | Import Value Growth Compared 2013 with 2011 | ||
| 2011 | 2012 | 2013 | |||
| 1 | China | 429,200 | 422,495 | 386,529 | -9.94% |
| 2 | USA | 123,984 | 131,240 | 109,269 | -11.87% |
| 3 | Singapore | 74,707 | 75,247 | 71,082 | -4.85% |
| 4 | Japan | 51,766 | 48,814 | 50,046 | -3.32% |
| 5 | Germany | 35,733 | 40,274 | 47,200 | 32.09% |
| 6 | Taiwan | 27,344 | 28,762 | 46,465 | 69.93% |
| 7 | Indonesia | 55,147 | 65,008 | 44,249 | -19.76% |
| 8 | Thailand | 21,641 | 27,606 | 37,513 | 73.34% |
| 9 | Republic of Korea | 39,976 | 43,639 | 34,454 | -13.81% |
| 10 | Hong Kong | 69,252 | 32,654 | 31,482 | -54.54% |
| 11 | Switzerland | 13,545 | 13,453 | 9,630 | -28.90% |
| 12 | France | 11,631 | 13,888 | 9,435 | -18.88% |
| 13 | Viet Nam | 10,031 | 5,472 | 8,894 | -11.33% |
| 14 | United Kingdom | 5,277 | 5,153 | 8,474 | 60.58% |
| 15 | Italy | 2,637 | 5,213 | 7,027 | 166.48% |
| 16 | Philippines | 5,823 | 5,849 | 6,126 | 5.20% |
| 17 | Australia | 2,189 | 3,181 | 4,411 | 101.51% |
| 18 | Netherlands | 2,972 | 2,719 | 3,131 | 5.35% |
| 19 | India | 3,511 | 5,405 | 2,703 | -23.01% |
| 20 | Hungary | 505 | 683 | 2,648 | 424.36% |
From 2011 to 2013, China, USA and Singapore were the top three import sources of electric wire and cable for Malaysia. In 2013, Malaysia imported 0.387 billion dollars of electric wire and cable from China, which accounted for 41.21% of the total import value of these products. Among the top twenty import markets for Malaysia in 2013, the import value from Italy, Australia and Hungary increased greatly, with 166.48%, 101.51% and 424.36% increase respectively, compared to 2011.
2011-2013 Malaysian Electric Wire and Cable Import Market Share Analysis
| No. | Import Countries / Regions | Import Value Percentage | ||
| 2011 | 2012 | 2013 | ||
| 1 | China | 42.19% | 42.53% | 41.21% |
| 2 | USA | 12.19% | 13.21% | 11.65% |
| 3 | Singapore↑ | 7.34% | 7.57% | 7.58% |
| 4 | Japan | 5.09% | 4.91% | 5.34% |
| 5 | Germany↑ | 3.51% | 4.05% | 5.03% |
| 6 | Taiwan↑ | 2.69% | 2.90% | 4.95% |
| 7 | Indonesia | 5.42% | 6.54% | 4.72% |
| 8 | Thailand↑ | 2.13% | 2.78% | 4.00% |
| 9 | Republic of Korea | 3.93% | 4.39% | 3.67% |
| 10 | Hong Kong | 6.81% | 3.29% | 3.36% |
| 11 | Switzerland | 1.33% | 1.35% | 1.03% |
| 12 | France | 1.14% | 1.40% | 1.01% |
| 13 | Viet Nam | 0.99% | 0.55% | 0.95% |
| 14 | United Kingdom | 0.52% | 0.52% | 0.90% |
| 15 | Italy↑ | 0.26% | 0.52% | 0.75% |
| 16 | Philippines↑ | 0.57% | 0.59% | 0.65% |
| 17 | Australia↑ | 0.22% | 0.32% | 0.47% |
| 18 | Netherlands | 0.29% | 0.27% | 0.33% |
| 19 | India | 0.35% | 0.54% | 0.29% |
| 20 | Hungary↑ | 0.05% | 0.07% | 0.28% |
Note: “↑”represents that the indicators listed continued to increase from 2011 to 2013.
Judging from the three-year market share, the import value in proportion of Singapore, Germany, Taiwan, Thailand, Italy, Philippines, Australia and Hungary continued to rise.
2014Q1 Malaysian Electric Wire and Cable Import Situation
| Countries / Regions | 2014 Jan. to Mar. Accumulative Import Value (Thousand Dollars) | Year on Year | Percentage |
| Total | 209,636 | -2.36% | 100.00% |
| China | 77,731 | -16.43% | 37.08% |
| USA | 27,144 | 9.48% | 12.95% |
| Singapore | 15,040 | -16.42% | 7.17% |
| Japan | 14,358 | 29.67% | 6.85% |
| Thailand | 14,337 | 247.65% | 6.84% |
| Taiwan | 12,413 | 30.68% | 5.92% |
| Germany | 10,940 | 42.89% | 5.22% |
| Republic of Korea | 7,380 | -20.95% | 3.52% |
| Indonesia | 5,140 | -50.79% | 2.45% |
| Hong Kong | 4,730 | -20.69% | 2.26% |
According to the statistics from Jan. to Mar. in 2014, Malaysia’ s accumulative import value of electric wire and cable was approximately 0.21 billion dollars, declined 2.36% year on year. China was the largest import source for electric wire and cable of Malaysia, which accounted for 37.08% of the total import value; followed by USA, which accounted for 12.95%.
Source:UN COMTRADE


