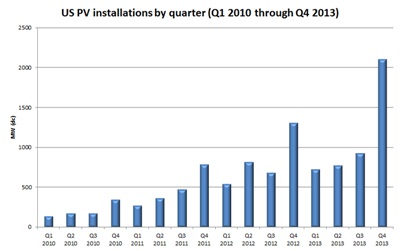
More than 13 GW of solar power generating capacity is now in place across the US, after 2013 witnessed a record 4.8 GW of installations, including some 2.8 GW in utility-scale projects.

The explosive growth figures come from GTM Research, the market research division of Greentech Media, and the US-based Solar Energy Industries Association (SEIA). In their new report, they say that the US solar industry has much to celebrate about the year 2013.
With PV installations up 41 per cent on the 2012 figure, solar became the second-largest source of new electricity-generating capacity in 2013.
Responsible for 29 per cent of all new capacity, solar ranked behind only installations of natural gas, which accounted for 46 per cent of new capacity. Ranking behind solar were both coal (10 per cent) and wind (8 per cent).
“The US solar market showed the first real glimpse of its path toward mainstream status in 2013,” claim the authors of the report. “The combination of rapid customer adoption, grassroots support for solar, improved financing terms, and public market successes indicated clear gains for solar in the eyes of both the general population and the investment community.”
That trend remains very much centered on a small number of states led by California which, together with Arizona and North Carolina, accounted for nearly 90 per cent of all utility-scale installations. Massachusetts and Georgia emerged as key new PV markets during the year.
Electricity generating capacity
With 12.1 GW of PV at peak output and 918 MW of concentrating solar now installed across the US, the two technologies theoretically account for just over 1 per cent of the country’s total nameplate electricity generating capacity. The US Energy Information Administration (EIA) estimated that total figure at 1200 GW in its 2012 figures.
However, the actual proportion of electricity generated by solar technologies is significantly lower than that, because of its intermittency and the current lack of storage options. In its figures for 2013, the EIA says that solar generated 9252 GW-hours* of electrical energy.
Although that figure was more than double the 4327 GW-hours* of solar produced in 2012, it represented only around 0.23 per cent of the total 4058 TW-hours* generated in the US overall.
Nevertheless, solar’s proportion will continue to increase quickly with the additional capacity connected to the grid during 2013. GTM Research and SEIA reported that the closing quarter of 2013 represented the strongest quarter ever for PV installations “by far” in the US, with 2.1 GW coming onstream.
“More solar has been installed in the US in the last 18 months than in the 30 years prior,” they point out. That is partly a result of the increased affordability of the technology. The new report finds that PV system cost dropped another 15 per cent in 2013 on average, hitting a new low of $2.59 per Watt by the end of the year. That was despite a slight increase in module prices, which was offset by cheaper inverters and racking systems.
2014 forecast
The trend is expected to continue this year, albeit at a slightly slower rate of growth. The report authors forecast that PV installations will grow another 26 per cent in 2014, to reach around 6 GW and put the cumulative total close to 20 GW.
With a new trade dispute on the table from SolarWorld, which is seeking to prevent rival Chinese module producers getting around US import tariffs by simply substituting PV cells made in Taiwan, that forecast is not without its risks.
But with solar seen by the authors to be becoming a serious part of the wider discussion of future electricity generation, they remain confident as the industry stands on the brink of a new phase. “If 2013 was about raising the issue, 2014 will be about defining solutions,” they predict.
“Increasingly, solar is not bound by its cost, but rather by its role in the electricity sector. And as solar continues along its path toward the mainstream, its integration with the broader electricity market from a technical, market and regulatory perspective will become one of the most important issues in the industry.”
* update (March 7): in the original text these figures were incorrectly stated as 9.25 GW-hours, 4.33 GW-hours and 4058 GW-hours respectively.


