| HS Code | Product Name |
| 6910 | Ceramic sinks, wash basins, wash basin pedestals, baths, bidets, water closet pans, flushing cisterns, urinals and similar sanitary fixtures, hereinafter referred to as the "ceramic sanitary ware" |
China Ceramic Sanitary Ware Export Volume and Value from Jan. to October in 2013
| Month | Volume (kg) | Value (USD) | YOY | |
|
|
|
| Volume | Value |
| January | 83,571,984 | 92,203,648 | 6.4% | 29.7% |
| February | 50,872,262 | 54,779,022 | 18.2% | 27.9% |
| March | 58,385,567 | 65,107,452 | -13% | -4.2% |
| April | 70,697,315 | 76,730,015 | -4.1% | 9.5% |
| May | 85,456,582 | 92,409,204 | 4.9% | 16.5% |
| June | 74,994,291 | 82,969,155 | -10.5% | 2.6% |
| July | 83,076,761 | 94,990,617 | 1% | 21.2% |
| August | 83,985,053 | 122,833,234 | -3.4% | 45.3% |
| September | 99,502,396 | 261,990,403 | 20.1% | 208.1% |
| October | 110,813,423 | 347,232,843 | 41.4% | 314.7% |
| Jan. to October Total | 801,355,634 | 1,291,245,593 | 5.7% | 73.6% |
The export volume of China ceramic sanitary ware from Jan. to October in 2013 amounted to 801356 tons, with an increase of 5.7%, while the export value amounted to 1.291 billion US dollars, with an increase of 73.6%. Among of which, the export value of September and October increased by 208.1% and 314.7% year on year.
China Ceramic Sanitary Ware Major Export Countries/Regions Distribution from Jan. to October in 2013
| No. | Countries/Regions | Volume (kg) | Value (USD) | Year-on-Year | |
|
|
|
|
| Volume | Volume |
| 1 | USA | 228,627,074 | 273,644,906 | 11.6% | 27.3% |
| 2 | South Korea | 80,871,026 | 79,791,350 | 6.5% | 24.8% |
| 3 | Malaysia | 15,206,777 | 58,672,725 | 159.5% | 592.5% |
| 4 | Saudi Arabia | 20,627,083 | 52,155,570 | 6.9% | 255.4% |
| 5 | Canada | 37,073,011 | 51,401,430 | -1.6% | 11.4% |
| 6 | UK | 31,800,186 | 47,756,954 | 25.5% | 61% |
| 7 | Iran | 6,773,077 | 42,599,157 | 336.4% | 2554.1% |
| 8 | Singapore | 10,968,193 | 41,496,992 | -47.6% | 171.7% |
| 9 | Philippines | 26,801,109 | 37,528,495 | -11% | 45% |
| 10 | Spain | 15,945,782 | 36,653,621 | 13.3% | 180.9% |
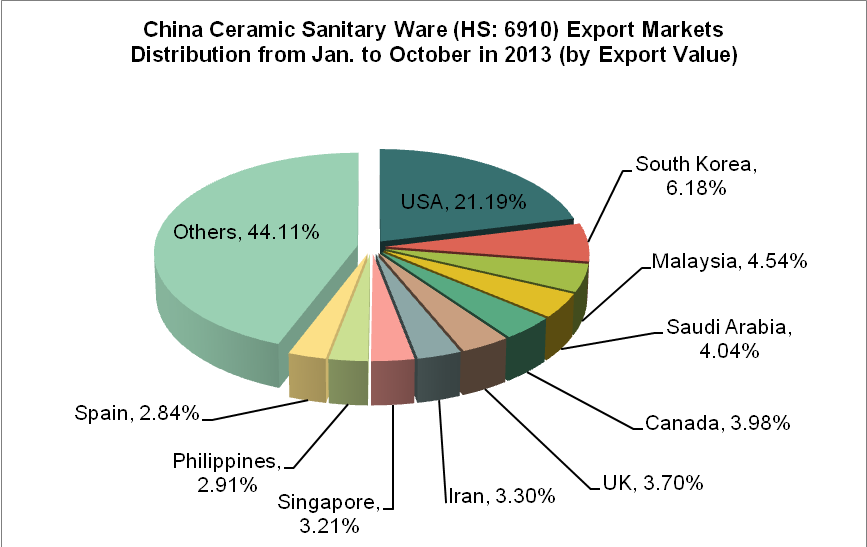
China's main export markets of ceramic sanitary ware were the United States, South Korea and Malaysia and etc. from Jan. to October in 2013. The export value to the United States accounted for 21.19% of our country's total export value of the product.
China Ceramic Sanitary Ware Export Source Areas from Jan. to October in 2013
| No. | Regions | Volume (kg) | Value (USD) | Year-on-Year | |
|
|
|
|
| Volume | Volume |
| 1 | Guangdong | 308,936,002 | 678,513,236 | 0.8% | 148.5% |
| 2 | Hebei | 278,701,697 | 288,297,198 | 10.5% | 14% |
| 3 | Fujian | 57,804,453 | 63,364,752 | -9.6% | 5.4% |
| 4 | Shandong | 36,474,727 | 51,325,999 | 1.8% | 16.7% |
| 5 | Jiangsu | 11,093,507 | 28,274,596 | 4.5% | 31.3% |
| 6 | Henan | 31,443,128 | 24,410,987 | 11.1% | 12% |
| 7 | Yunnan | 3,093,694 | 22,070,649 | 37173% | 105810% |
| 8 | Shanghai | 9,372,135 | 20,860,161 | -2.4% | 2% |
| 9 | Liaoning | 2,905,773 | 17,107,522 | 1048.1% | 3833.4% |
| 10 | Hubei | 21,471,561 | 16,024,594 | 16.8% | 36.7% |
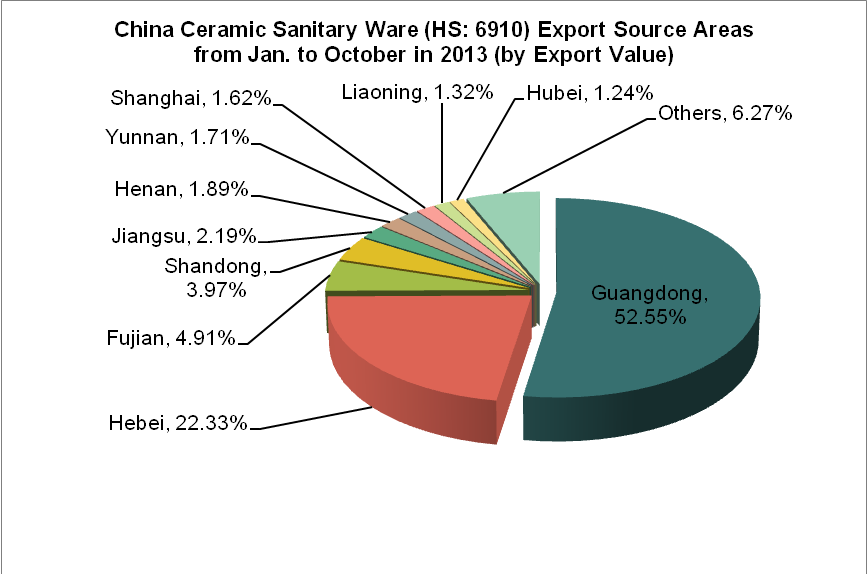
Guangdong and Hebei are our country's ceramic sanitary ware main source areas. From Jan. to October in 2013, the export value of the above two provinces accounted for 74.87% of China's total export value of the product. Among the top ten original places of ceramic sanitary ware of our country, the export value in Yunnan increased the largest, with an increase of 105810%, followed by Liaoning, with an increase of 3833.4% year on year.
Source: Customs Information Network


")


