2013 China Seats and Parts Exports
2013 China Seats and Parts (HS: 9401) Exports
Jan.-Apr. 2013 China Seats and Parts(HS:9401)Export Quantity and Amount
| Month | Quantity(-) | Amount(USD) | Compared with the same period last year | |
|
|
|
| Quantity | Amount |
| Jan. | 113,407,256 | 2,412,352,779 | 7.7% | 47.2% |
| Feb. | 73,228,076 | 1,526,859,565 | 13.4% | 48.9% |
| Mar. | 90,386,070 | 1,664,357,555 | -16.2% | -5.1% |
| Apr. | 98,311,276 | 1,950,507,720 | -2.6% | 3.2% |
| Cumulatively Jan. - Apr. | 375,332,678 | 7,554,077,619 | -0.9% | 19.7% |
From Jan. to Apr. 2013, China seats and parts exports amounted to $ 7.554 billion, with an increase of 19.7%.
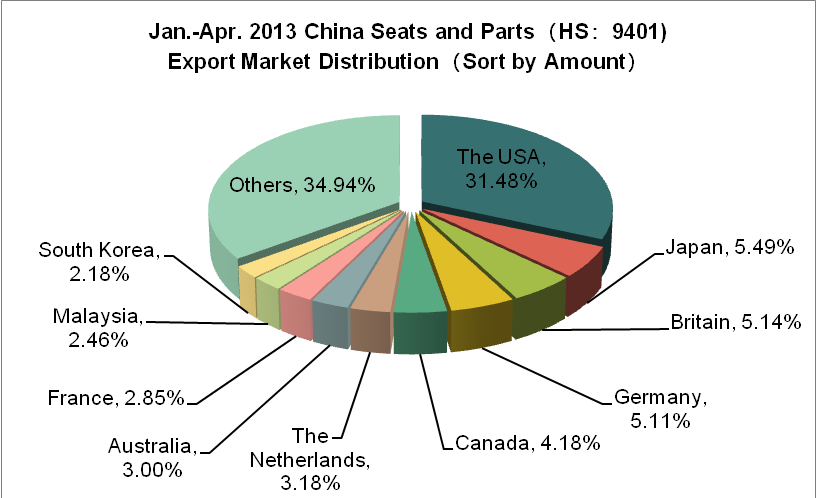
3.1.2. Jan.-Apr. 2013 China Seats and Parts(HS:9401)Major Export Country/Region
| NO. | Country | Quantity(-) | Amount(USD) | Compared with the same period last year | |
|
|
|
|
| Quantity | Amount |
| 1 | The USA | 133,089,567 | 2,378,307,633 | -2.4% | 8.4% |
| 2 | Japan | 23,781,952 | 414,373,261 | -8.8% | -3.7% |
| 3 | Britain | 14,632,960 | 388,235,789 | -4% | 1.8% |
| 4 | Germany | 21,512,721 | 386,204,130 | -4% | -4.5% |
| 5 | Canada | 15,084,354 | 315,398,667 | / | 5.7% |
| 6 | The Netherlands | 6,844,016 | 240,093,455 | -11.4% | 12.7% |
| 7 | Australia | 6,597,010 | 226,352,684 | -1.1% | 23% |
| 8 | France | 8,615,550 | 215,056,286 | -14.1% | -5.1% |
| 9 | Malaysia | 5,813,115 | 185,625,975 | -4.9% | 125.5% |
| 10 | South Korea | 8,053,850 | 164,740,032 | 4.7% | 32.4% |

From Jan. to April in 2013, among the top ten export destination countries, the export value of seats and parts to seven of the countries increased. Seen from the export value year on year, the largest increase was in Malaysia (with an increase of 125.5%), followed by South Korea (with an increase of 32.4%).
Jan.-Apr. 2013 China Seats and Parts(HS:9401)Manufacturing Enterprises Distribution
| No. | Region | Quantity(-) | Amount(USD) | Compared with the same period last year | |
|
|
|
|
| Quantity | Amount |
| 1 | Guangdong Province | 99,971,722 | 3,154,465,252 | -3.6% | 38.9% |
| 2 | Zhejiang Province | 144,873,057 | 2,160,940,426 | 2.5% | 5.2% |
| 3 | Jiangsu Province | 43,716,164 | 566,279,679 | -4% | 3.1% |
| 4 | Shanghai | 27,787,229 | 426,110,010 | -15.4% | -5.5% |
| 5 | Fujian Province | 23,451,070 | 313,956,037 | -3.3% | 5.4% |
| 6 | Shandong Province | 9,518,305 | 169,925,119 | 5.4% | 8.8% |
| 7 | Jiangxi Province | 2,219,273 | 126,877,331 | 20.7% | 63.1% |
| 8 | Anhui Province | 2,051,335 | 112,129,622 | 90.1% | 470.4% |
| 9 | Hebei Province | 7,097,716 | 100,409,120 | 6.6% | 28.5% |
| 10 | Liaoning Province | 2,764,153 | 90,238,524 | 16.7% | 111.7% |
Guangdong and Zhejiang are our country's main original places of seats and parts. From Jan. to April in 2013, the export volume of the two provinces mentioned above accounted for 65.23% of the total export volume of our country, and the export value accounted for 70.36% of the total export value. Among the top ten original places of seats and parts, the export volume and value of Anhui province increased the largest, with an increase of 90.1% of the export volume and 470.4% of the export value year on year.
(Source: China Customs Network)


