Export Quantity & Value for Chinese Headphone from Jan. to Dec. 2013
| Month | Quantity (Piece) | Value (USD) | Year on Year | |
| Quantity | Value | |||
| Jan. | 154,521,926 | 364,949,643 | 9% | 33.4% |
| Feb. | 118,173,833 | 248,359,931 | 9.2% | 17.1% |
| March | 125,120,848 | 273,041,709 | -23.2% | -13.1% |
| April | 172,947,316 | 362,937,537 | 6% | 13.1% |
| May | 184,114,598 | 363,372,895 | 5.7% | 3.5% |
| June | 168,070,981 | 316,979,863 | 1.1% | -5.4% |
| July | 187,247,164 | 351,954,162 | 20.5% | 9.6% |
| August | 166,378,414 | 350,420,664 | -5.1% | -4.1% |
| Sep. | 163,685,363 | 362,219,013 | -12% | -9.1% |
| Oct. | 170,234,441 | 396,867,705 | -7.9% | -9.8% |
| Nov. | 173,288,940 | 409,224,648 | 12.8% | 2.4% |
| Dec. | 153,223,965 | 347,404,731 | -16.8% | -27.3% |
| Total from Jan. to Dec. | 1,937,007,789 | 4,147,732,501 | -1% | -1.5% |
The total export quantity for Chinese headphone from Jan. to Dec. 2013 achieved 1937 million pieces, and declined 1% year on year. The total export value reached 4148 million USD, and declined 1.5% year on year.
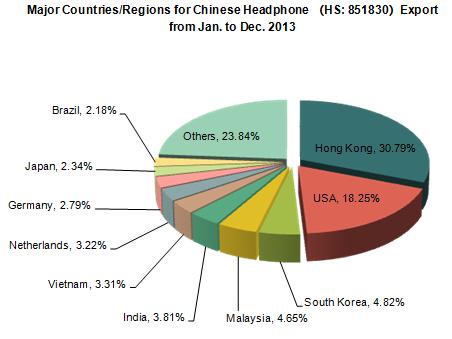
Major Countries/Regions for Chinese Headphone Export from Jan. to Dec. 2013
| No. | Countries/Regions | Quantity (Piece) | Value (USD) | Year on Year | |
| Quantity | Value | ||||
| 1 | Hong Kong | 421,995,735 | 1,276,899,990 | -13.2% | -7.6% |
| 2 | USA | 277,310,727 | 756,853,388 | -6.2% | -9% |
| 3 | South Korea | 111,391,404 | 200,098,444 | -4.6% | 15.1% |
| 4 | Malaysia | 78,400,770 | 192,901,489 | 47.8% | 9.4% |
| 5 | India | 125,829,081 | 157,858,353 | 5.8% | -3.8% |
| 6 | Vietnam | 72,522,898 | 137,332,144 | 6.3% | 54% |
| 7 | Netherlands | 41,486,209 | 133,715,736 | 5% | -0.3% |
| 8 | Germany | 59,045,875 | 115,761,107 | -15.7% | -11% |
| 9 | Japan | 44,584,271 | 97,012,434 | -0.8% | 4.5% |
| 10 | Brazil | 86,016,046 | 90,472,418 | -4.1% | 12.6% |

Hong Kong ranked first for Chinese headphone export. The total export value to Hong Kong for Chinese headphone from Jan. to Dec. 2013 was about 1277 million USD, declined 7.6% year on year, and occupied 30.79% of all. Followed by USA, and occupied 18.25%.
Major Cities/Provinces for Chinese Headphone Export from Jan. to Dec. 2013
| No. | Cities/Provinces | Quantity (Piece) | Value (USD) | Year on Year | |
| Quantity | Value | ||||
| 1 | Guangdong | 1,100,502,946 | 2,735,416,724 | 5.8% | 0.1% |
| 2 | Guangxi | 71,787,267 | 317,843,370 | -12.8% | -14.1% |
| 3 | Shandong | 89,615,449 | 203,008,298 | -36.9% | -16.7% |
| 4 | Jiangsu | 131,821,096 | 191,566,629 | -19.7% | -6% |
| 5 | Tianjin | 70,756,506 | 141,253,297 | -12.1% | 20.8% |
| 6 | Jiangxi | 151,274,492 | 107,376,973 | 38.4% | 31.3% |
| 7 | Zhejiang | 206,494,848 | 92,017,188 | -4.1% | 7.6% |
| 8 | Hunan | 13,577,287 | 71,660,657 | -39% | -45.6% |
| 9 | Shanghai | 13,199,306 | 56,669,168 | 126.1% | 309.5% |
| 10 | Heilongjiang | 11,524,973 | 56,538,182 | 21.6% | 153.4% |
The major city/province for Chinese headphone export was Guangdong, which occupied 56.81% and 65.95% of the total export quantity & value from Jan. to Dec. 2013 respectively.


