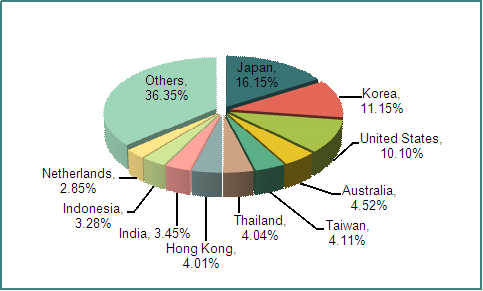
Export Quantity & Value for Chinese Inorganic Chemicals (HS:28) from Jan. to April in 2012
| Product Name | Measurement | Month | Quantity (Unit) | Value (USD) | Year on Year (±%) | |
|
|
|
|
|
| Quantity | Value |
| Inorganic Chemicals | — | Jan. | 1,420,466,832 | 1,194,535,500 | -10.6 | 3.4 |
|
|
| Feb. | 1,196,847,330 | 943,006,400 | 2.5 | 17.9 |
|
|
| March | 1,593,011,329 | 1,313,896,600 | -9.5 | -18.4 |
|
|
| April | 1,454,277,790 | 1,123,051,400 | -13.1 | -29.1 |
|
|
| Total | 5,664,603,281 | 4,574,490,000 | -8.5 | -11.1 |
The total export quantity for Chinese inorganic chemicals from Jan. to April in 2012 achieved 5,664,603,281, and declined 8.5% year on year; the total export value reached 4,574,490 thousand USD, and declined 11.1% year on year.
Major Countries/Regions for Chinese Inorganic Chemicals (HS:28) Export from Jan. to April in 2012 (Sorted by Value)
| No. | Countries/Regions | From Jan. to April in 2012 | Year on Year (±%) | ||
|
|
| Quantity (Unit) | Value (USD) | Quantity | Value |
| 1 | Japan | 455,606,359 | 738,650,400 | -2.5 | -33.9 |
| 2 | South Korea | 567,367,338 | 509,922,300 | -12.9 | -6.4 |
| 3 | USA | 255,159,658 | 461,977,400 | -36.5 | -24.8 |
| 4 | Australia | 390,037,084 | 206,614,800 | 42.4 | 67.4 |
| 5 | Taiwan | 173,920,361 | 187,937,800 | -22.5 | -12.8 |
| 6 | Thailand | 314,759,982 | 184,911,200 | 4.3 | 5.5 |
| 7 | Hong Kong | 74,254,947 | 183,486,300 | -10.1 | 28.9 |
| 8 | India | 175,388,003 | 157,923,900 | -5.9 | -1.8 |
| 9 | Indonesia | 355,158,862 | 150,099,100 | -11.6 | 7.7 |
| 10 | Netherlands | 52,804,788 | 130,152,200 | -25.3 | -33.2 |
| 11 | Malaysia | 266,740,409 | 125,737,300 | 11.7 | 42.8 |
| 12 | Vietnam | 251,616,727 | 96,653,000 | -34 | -12.9 |
| 13 | Brazil | 252,912,656 | 91,105,700 | -2.9 | 10.6 |
| 14 | Russian Federation | 73,213,359 | 75,037,000 | 10 | 28.5 |
| 15 | Germany | 28,872,023 | 73,162,300 | -33.1 | -50.3 |
| 16 | Canada | 57,868,580 | 72,133,500 | 2.2 | -3.9 |
| 17 | France | 21,170,599 | 71,884,300 | -6.1 | -3.2 |
| 18 | Philippines | 163,139,376 | 67,350,100 | -19.8 | 9.2 |
| 19 | Belgium | 33,181,555 | 48,726,400 | -12.4 | 13.4 |
| 20 | Singapore | 67,722,117 | 47,418,500 | -5.1 | -14.3 |

The major countries for Chinese inorganic chemicals export from Jan. to April in 2012 were Japan, South Korea, USA, Australia, Taiwan, Thailand, Hong Kong, India, Indonesia, and Netherlands and so on. The export value to Japan, South Korea and USA all declined year on year to an extent.
Major Customs for Chinese Inorganic Chemicals (HS:28) Export from Jan. to April in 2012 (Sorted by Value
| Product Name | By Customs | From Jan. to April in 2012 | Year on Year (±%) | Total Occupied(%) | ||
|
|
| Quantity (Unit) | Value (USD) | Quantity | Value |
|
| Inorganic Chemicals | Shanghai Customs | 512,187,893 | 932,697,951,000 | -21.4 | -30.1 | 20.39% |
|
| Tianjin Customs | 1,105,791,027 | 831,823,837,000 | 2.4 | 1.7 | 18.18% |
|
| Huangpu Customs | 340,117,567 | 604,324,857,000 | -13.7 | -20.6 | 13.21% |
|
| Qingdao Customs | 1,028,496,618 | 485,175,098,000 | -8.1 | -3.9 | 10.61% |
|
| Nanjing Customs | 1,322,107,643 | 388,059,009,000 | -10.7 | 7.9 | 8.48% |
|
| Xiamen Customs | 70,552,857 | 248,500,159,000 | -16.8 | 11.1 | 5.43% |
|
| Nanning Customs | 210,984,285 | 168,682,422,000 | -20 | -7.5 | 3.69% |
|
| Dalian Customs | 170,116,133 | 164,872,807,000 | -11.8 | -24.4 | 3.60% |
|
| Nanchang Customs | 34,541,696 | 81,284,041 | -4.3 | -33.2 | 1.78% |
|
| Ningbo Customs | 59,069,550 | 80,164,434 | 40.3 | 9.5 | 1.75% |
The major Customs for Chinese inorganic chemicals export from Jan. to April in 2012 were Shanghai, Tianjin and Huangpu, which occupied 20.39%, 18.18% and 13.21% respectively of the total export value.


