China Plastic Sanitary Ware (HS: 3922) Exports from Jan. to Oct. 2013
China Plastic Sanitary Ware Export Volume and Value from Jan. to Oct. 2013
| Month | Volume (kg) | Value (USD) | YOY | |
|
|
|
| Volume | Volume |
| Jan. | 24,016,637 | 120,156,662 | 22.5% | 119.3% |
| Feb. | 14,939,294 | 81,755,200 | 79.8% | 207.4% |
| Mar. | 13,227,836 | 62,199,091 | -20.3% | 13.4% |
| Apr. | 19,925,316 | 96,134,830 | 3% | -3.4% |
| May | 21,783,401 | 108,638,568 | -7.5% | -23.7% |
| Jun. | 18,849,808 | 87,418,633 | -20.9% | -39.2% |
| Jul. | 17,948,108 | 79,266,824 | -18.8% | -42.1% |
| Aug. | 16,944,322 | 74,581,328 | -27.4% | -43% |
| Sep. | 15,324,013 | 65,641,852 | -34% | -44.1% |
| Oct. | 14,988,301 | 66,259,401 | -33.1% | -44.3% |
| Jan. to Oct. Total | 177,947,036 | 842,052,389 | -12.1% | -17.9% |
The export volume of China plastic sanitary ware from Jan. to Oct. 2013 amounted to 177,900 tons, with a decrease of 12.1%, while the export value amounted to 842 million US dollars, with a decrease of 17.9%. Among of which, the export value and volume of January and February both increased year on year.
China Plastic Sanitary Ware Major Export Countries/Regions Distribution from Jan. to Oct. 2013
| No. | Countries | Volume (kg) | Value (USD) | YOY | |
|
|
|
|
| Volume | Volume |
| 1 | USA | 23,122,097 | 101,721,421 | -0.2% | -5.4% |
| 2 | United Kingdom | 13,179,587 | 60,255,852 | 2% | 1.2% |
| 3 | Australia | 8,694,328 | 40,753,488 | -17.7% | -23.5% |
| 4 | Malaysia | 4,943,371 | 34,379,545 | -13.4% | -8.9% |
| 5 | Germany | 7,767,826 | 32,697,510 | -9.9% | -20.2% |
| 6 | Singapore | 3,895,744 | 30,598,107 | -0.6% | 0.2% |
| 7 | France | 6,669,119 | 25,355,669 | 28.7% | 28.7% |
| 8 | Japan | 5,198,664 | 24,661,991 | -0.1% | -6.4% |
| 9 | United Arab Emirates | 4,931,032 | 24,493,160 | -12% | -22.4% |
| 10 | Netherlands | 4,802,498 | 22,854,069 | -7.3% | -16.5% |
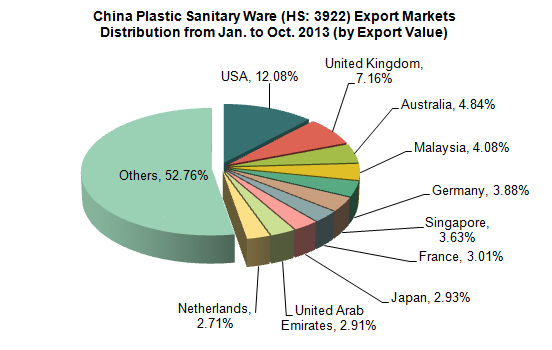
China's main export markets of plastic sanitary ware were the United States, the United Kingdom, Australia and Malaysia and etc. from Jan. to Oct. 2013. The export value to the United States accounted for 12.08% of our country's total export value of the product.
China Plastic Sanitary Ware Export Source Areas from Jan. to Oct. 2013
| No. | Regions | Volume (kg) | Value (USD) | YOY | |
|
|
|
|
| Volume | Volume |
| 1 | Guangdong | 67,213,679 | 374,200,545 | -17.7% | -15.5% |
| 2 | Zhejiang | 32,047,773 | 121,763,475 | 2.4% | 9.4% |
| 3 | Fujian | 20,937,927 | 105,781,276 | -7.7% | -11.2% |
| 4 | Shanghai | 16,876,883 | 60,375,884 | 4.3% | 8.8% |
| 5 | Jiangsu | 9,673,305 | 37,236,828 | -14% | -31.4% |
| 6 | Hebei | 6,792,052 | 32,365,377 | -12.4% | -6.9% |
| 7 | Anhui | 9,761,663 | 26,968,870 | -18.1% | -35.7% |
| 8 | Jiangxi | 3,153,513 | 18,730,789 | 15.9% | -34.3% |
| 9 | Xinjiang Uygur Autonomous Region | 3,763,283 | 15,073,030 | 36.4% | 28.6% |
| 10 | Chongqing | 1,529,988 | 11,947,403 | -75.1% | -81.8% |
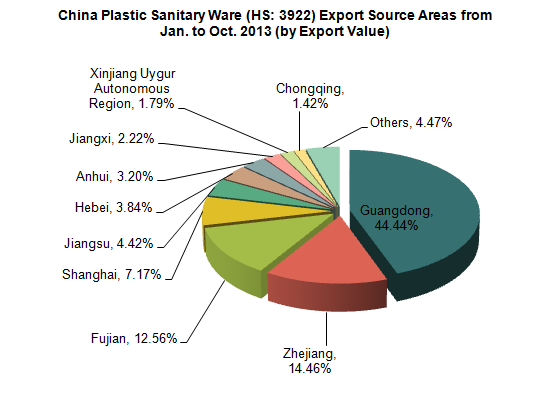
Guangdong, Zhejiang and Fujian are our country's plastic sanitary ware main source areas. From Jan. to Oct. 2013, the export value of the above three provinces accounted for 71.46% of China's total export value of the product.
Source: Customs Information Network


