Distribution of China's Plastics and Articles Export Enterprises
| No. | Region | Export Value | Y-o-Y | ||
| Volume(kg) | Value(USD) | Volume | Value | ||
| 1 | Guangdong | 5,395,314,642 | 21,659,547,588 | -1.20% | -6% |
| 2 | Zhejiang | 4,694,361,926 | 15,183,567,778 | 5.90% | 11.60% |
| 3 | Jiangsu | 4,533,673,092 | 10,177,848,099 | 1.70% | -3.90% |
| 4 | Shanghai | 1,912,420,397 | 5,425,722,666 | 0.20% | -5% |
| 5 | Shandong | 1,667,620,357 | 4,008,124,543 | 8.10% | 0.20% |
| 6 | Fujian | 778,634,156 | 2,503,668,644 | -3.70% | -6% |
| 7 | Hebei | 401,363,086 | 1,022,880,659 | 5.30% | -3.50% |
| 8 | Tianjin | 378,868,430 | 734,847,927 | -2.10% | -6.90% |
| 9 | Anhui | 273,908,379 | 655,931,311 | 3.60% | 6.10% |
| 10 | Liaoning | 260,959,968 | 590,719,077 | 5.50% | -11.20% |
From January to December, Guangdong, Zhejiang and Jiangsu were the main regions where China's plastics and articles export enterprise located. The three provinces' total export value accounted for 71.5% of China's total. Guangdong's export value accounted for 33% of the total.
Major Countries/Regions for China's Plastics and Articles Export
| No. | Country/Region | Export Value | Y-o-Y | ||
| Volume(kg) | Value(USD) | Volume | Value | ||
| 1 | America | 4,006,840,442 | 13,987,987,312 | 4.90% | 9.80% |
| 2 | Hong Kong | 1,206,887,816 | 4,608,186,771 | -3.90% | -9.80% |
| 3 | Japan | 1,403,623,572 | 4,067,962,229 | 1.20% | -7.30% |
| 4 | India | 897,810,561 | 2,129,541,232 | -8.80% | -4.80% |
| 5 | Korea | 602,824,221 | 2,036,004,238 | 7.80% | 14% |
| 6 | England | 472,258,487 | 1,777,034,970 | 10.60% | 6.90% |
| 7 | Vietnam | 576,015,722 | 1,715,717,485 | 22.80% | 19.20% |
| 8 | Australia | 524,849,396 | 1,704,233,754 | 9% | 7.40% |
| 9 | Malaysia | 555,503,169 | 1,673,806,375 | 1% | -0.60% |
| 10 | Germany | 449,430,229 | 1,592,692,641 | 9.50% | -0.30% |
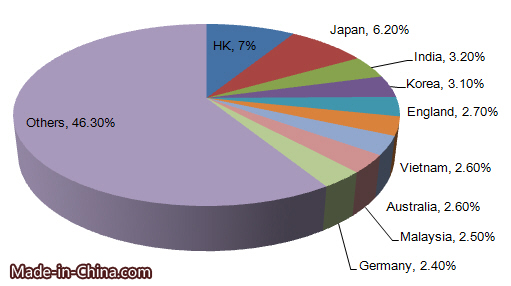
From Jan. to Dec. in 2015, America, Hong Kong, Japan, India, Korea, England, Vietnam, Australia, Malaysia and Germany were major countries for China's plastics and articles export, among of which, America topped the list of the export value. The export value to America accounted for 21.3% of China's plastics and articles total export value from January to December in 2015.
Major Countries/Regions in Need of Plastics and Articles
| Importing Country/Region | Import Value(USD) | Y-o-Y |
| China | 49,939,088,000 | -12.20% |
| America | 38,435,752,000 | 1.70% |
| Germany | 29,959,957,000 | -14.40% |
| France | 17,021,673,000 | -15.80% |
| Mexico | 16,705,889,000 | 1.50% |
From January to September in 2015, major plastics and articles importing countries were China, America, Germany, France and Mexico. As the largest importing country, China's import value was USD 49939 million.
Major Plastics and Articles Exporting Countries
| Exporting Country/Region | Export Value(USD) | Y-o-Y |
| China | 48,746,940,000 | -1.30% |
| Germany | 46,424,340,000 | -15.70% |
| America | 45,983,830,000 | -3.60% |
| Korea | 21,587,245,000 | -9.90% |
| Belgium | 21,118,889,000 | -15.40% |
From January to September in 2015, major plastics and articles export countries included China, Germany, America, Korea and Belgium. China was the largest export country with the export value of USD 48747 million.


