China Office Supplies Major Export Countries/Regions
China Fittings for loose leaf binders, staples and other office supplies (HS: 8305) Major Export Countries/Regions, from Jan. to Dec. 2013 (By export value)
| No. | Country/Region | Accumulative total from Jan.-Dec. | Accumulatively compared to the same period of last year | ||
| Quantity (kg) | Value (USD) | Quantity | Value | ||
| 1 | USA | 51,404,848 | 117,372,751 | -10.2% | -11.1% |
| 2 | Malaysia | 5,984,906 | 18,055,207 | -20.4% | -4.2% |
| 3 | Germany | 6,272,187 | 17,341,792 | -9.1% | 14.8% |
| 4 | Japan | 4,031,047 | 14,364,965 | 0.2% | -0.5% |
| 5 | South Africa | 3,520,112 | 11,789,168 | 1% | 14.4% |
| 6 | Indonesia | 4,821,224 | 11,365,044 | -4.4% | 0.3% |
| 7 | Mexico | 4,516,412 | 11,100,441 | 3.6% | 9.2% |
| 8 | Canada | 4,102,446 | 10,183,999 | -22.6% | -10.7% |
| 9 | Iran | 2,436,205 | 9,705,419 | 85.2% | 162.1% |
| 10 | Hong Kong | 4,832,263 | 9,408,188 | -42.6% | -20.5% |
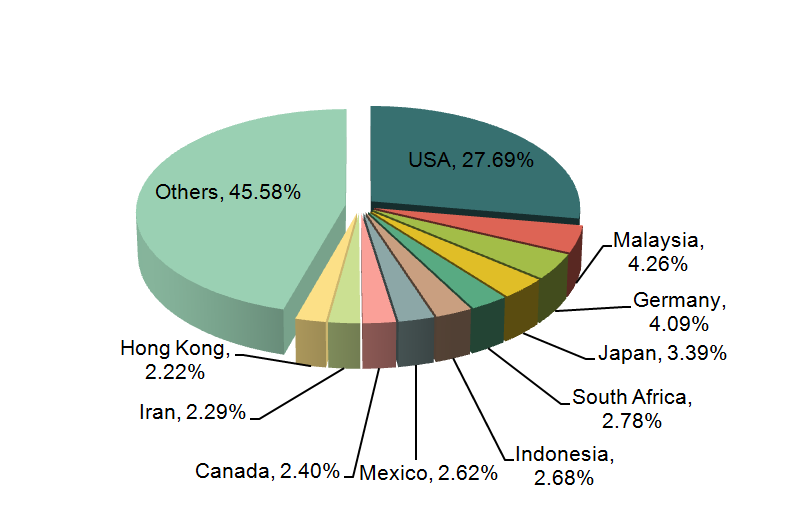
China's total export quantity and value of fittings for loose leaf binders, staples and other office supplies in 2013 amounted to 159,100 tons and 424 million US dollars, with a decrease of 9.6% and 2.1% respectively compared to that in the same period of 2012. China’s fittings for loose leaf binders, staples and other office supplies main export countries/regions were the United States, Malaysia, Germany, Japan, South Africa, Indonesia, Mexico, Canada, Iran and Hong Kong and so on from Jan. to Dec., 2013. The United States was the main export market of our country's fittings for loose leaf binders, staples and other office supplies, and the export value to the United States in 2013 accounted for 27.69% of the total export value of the products. Among the top ten fittings for loose leaf binders, staples and other office supplies export markets in 2013, the export value to Iran increased by 162.1% YOY, for the largest increase in value.
China Book-binding machinery (HS: 8440) Major Export Countries/Regions, from Jan. to Dec. 2013 (By export value)
| No. | Country/Region | Accumulative total from Jan.-Dec. | Accumulatively compared to the same period of last year | ||
|
|
| Quantity (-) | Value (USD) | Quantity | Value |
| 1 | Viet Nam | 28,077 | 4,560,445 | 240.2% | 407.7% |
| 2 | Hong Kong | 10,256 | 2,945,935 | 5.4% | 82.8% |
| 3 | Russian Federation | 9,618 | 2,126,742 | 35.3% | 2.1% |
| 4 | Indonesia | 2,224 | 1,662,501 | -32.7% | 169.3% |
| 5 | USA | 11,688 | 1,449,213 | -54.6% | 7.8% |
| 6 | Italy | 35,065 | 1,026,644 | 417.3% | 80.2% |
| 7 | Republic of Korea | 12,654 | 980,460 | -6.7% | 8% |
| 8 | Malaysia | 3,983 | 943,016 | -56.9% | 81.2% |
| 9 | India | 3,816 | 921,347 | -18.4% | 106.7% |
| 10 | Brazil | 5,857 | 897,530 | 319.9% | -3.7% |
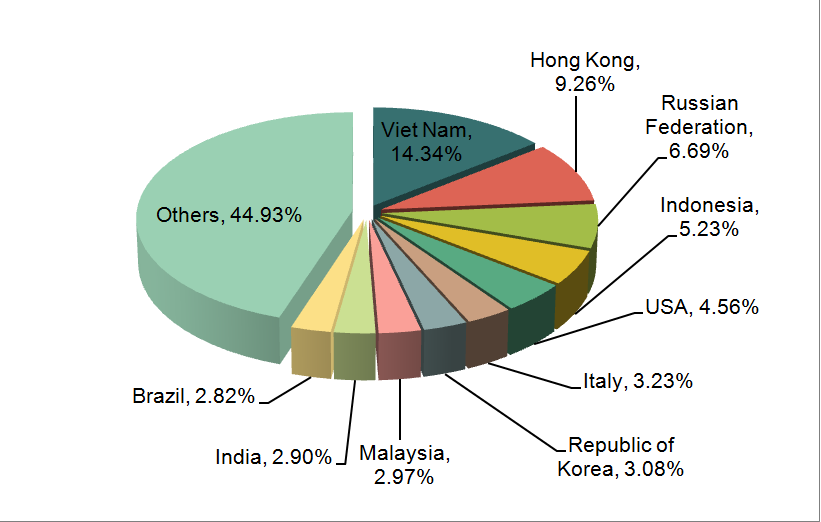
China's total export quantity and value of book-binding machinery in 2013 amounted to 349,000 and 32 million US dollars, with a year-on-year decrease of 1.9% in export quantity and a year-on-year increase of 31.3% in export value. China’s book-binding machinery main export markets were Vietnam, Hong Kong, the Russian Federation, Indonesia, the United States, Italy, the Republic of Korea, Malaysia, India, and Brazil and so on from Jan. to Dec., 2013. Vietnam was the main export market of our country's book-binding machinery, and the export value to Vietnam in 2013 accounted for 14.34% of the total export value of the products. Among the top ten book-binding machinery export markets in 2013, the export value to Vietnam, Indonesia and India increased by 407.7%, 169.3% and 106.7% YOY respectively, for a large increase in value.
China Typewriters (HS: 8469) Major Export Countries/Regions, from Jan. to Dec. 2013 (By export value)
| No. | Country/Region | Accumulative total from Jan.-Dec. | Accumulatively compared to the same period of last year | ||
|
|
| Quantity (set) | Value (USD) | Quantity | Value |
| 1 | USA | 676,954 | 13,534,184 | -15.3% | -21.8% |
| 2 | Belgium | 408,824 | 5,624,242 | -25.2% | -21% |
| 3 | Australia | 155,939 | 1,850,686 | -10.2% | -11.2% |
| 4 | Germany | 215,103 | 1,734,025 | 5.6% | -2.5% |
| 5 | United Kingdom | 11,904 | 600,819 | -30.3% | -33.6% |
| 6 | Hong Kong | 19,439 | 425,463 | -32.1% | 29.2% |
| 7 | Macau | 8,204 | 412,437 | 16308% | 319618.6% |
| 8 | Indonesia | 4,378 | 290,635 | -58.1% | -55.4% |
| 9 | Malaysia | 10,314 | 198,205 | 62.6% | -13.8% |
| 10 | Russian Federation | 764 | 112,326 | 140.3% | 88.1% |
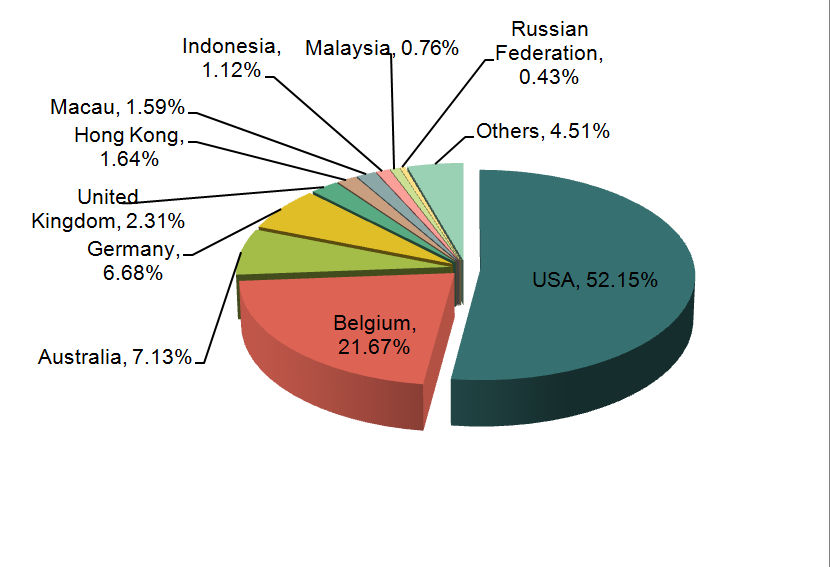
China's total export quantity and value of typewriters in 2013 amounted to 1.5442 million sets and 26 million US dollars, with a year-on-year decrease of 15% and 18.9% respectively. As can be seen from the export data of Jan.-Dec. 2013, China’s typewriters main export markets were the United States, Belgium, Australia, Germany, the United Kingdom, Hong Kong, Macau, Indonesia, Malaysia and the Russian Federation and so on. The United States was the main export market of our country's typewriters, and the export value to the United States accounted for 52.15% of the total export value of the products.
China Instruments, apparatus & models, designed for demonstrational purposes (HS: 9023) Major Export Countries/Regions, from Jan. to Dec. 2013 (By export value)
| No. | Country/Region | Accumulative total from Jan.-Dec. | Accumulatively compared to the same period of last year | ||
|
|
| Quantity (kg) | Value (USD) | Quantity | Value |
| 1 | Hong Kong | 10,398,395 | 212,279,187 | 102.4% | 117.9% |
| 2 | USA | 5,736,543 | 112,879,385 | -30.3% | -23.5% |
| 3 | Japan | 1,260,488 | 44,054,447 | -2.9% | -25.6% |
| 4 | Germany | 1,371,741 | 30,478,819 | -14.9% | -17.4% |
| 5 | Malaysia | 1,448,904 | 25,161,418 | -18.2% | -0.2% |
| 6 | Singapore | 1,414,300 | 23,452,223 | 33% | -2.1% |
| 7 | Netherlands | 891,374 | 20,298,947 | -18.5% | -13.5% |
| 8 | Iran | 976,392 | 19,616,135 | 525% | 694.9% |
| 9 | India | 1,302,075 | 19,326,347 | 71.7% | 110.8% |
| 10 | United Kingdom | 704,393 | 16,063,356 | -40.7% | -42.1% |
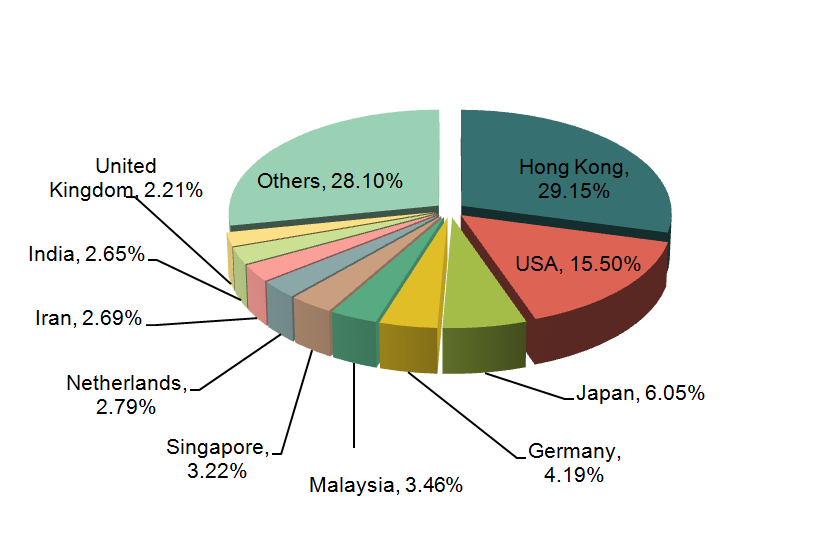
China's total export quantity and value of instruments, apparatus & models, designed for demonstrational purposes in 2013 amounted to 37,600 tons and 728 million US dollars, with a decrease of 30.3% and 27% respectively compared to that in the same period of 2012. China’s instruments, apparatus & models, designed for demonstrational purposes main export markets were Hong Kong, the United States, Japan, Germany, Malaysia, Singapore, the Netherlands, Iran, India and the United Kingdom and so on from Jan. to Dec., 2013. Hong Kong was the main export market of our country's instruments, apparatus & models, designed for demonstrational purposes, and the export value to Hong Kong in 2013 amounted to 212 million US dollars, with a year-on-year increase of 117.9%, accounting for 29.15% of the total export value of the products. In addition to export value's more than 100% increase to Hong Kong, the export value to Iran and India also increased fast, with an increase of 694.9% and 110.8% respectively YOY.
China Ballpoint pencil, markers & parts (HS: 9608) Major Export Countries/Regions, from Jan. to Dec. 2013 (By export value)
| No. | Country/Region | Accumulative total from Jan.-Dec. | Accumulatively compared to the same period of last year | ||
|
|
| Quantity (-) | Value (USD) | Quantity | Value |
| 1 | USA | 3,245,127,561 | 371,597,002 | 3.6% | 3.4% |
| 2 | Hong Kong | 318,199,545 | 100,203,916 | -9.5% | 91.1% |
| 3 | Japan | 352,623,603 | 93,643,806 | -2% | 4.5% |
| 4 | Germany | 433,430,540 | 72,612,687 | -10.2% | -7.4% |
| 5 | United Kingdom | 1,015,123,994 | 69,000,226 | -5.3% | -0.7% |
| 6 | Malaysia | 374,042,233 | 47,592,895 | -0.9% | 6.3% |
| 7 | Viet Nam | 204,602,451 | 46,872,741 | -49.2% | -40.1% |
| 8 | Netherlands | 435,749,149 | 40,977,171 | 12.1% | 6.3% |
| 9 | Mexico | 455,943,034 | 40,897,989 | -4.3% | 1.8% |
| 10 | Russian Federation | 725,360,657 | 39,124,795 | 23.5% | 16.5% |
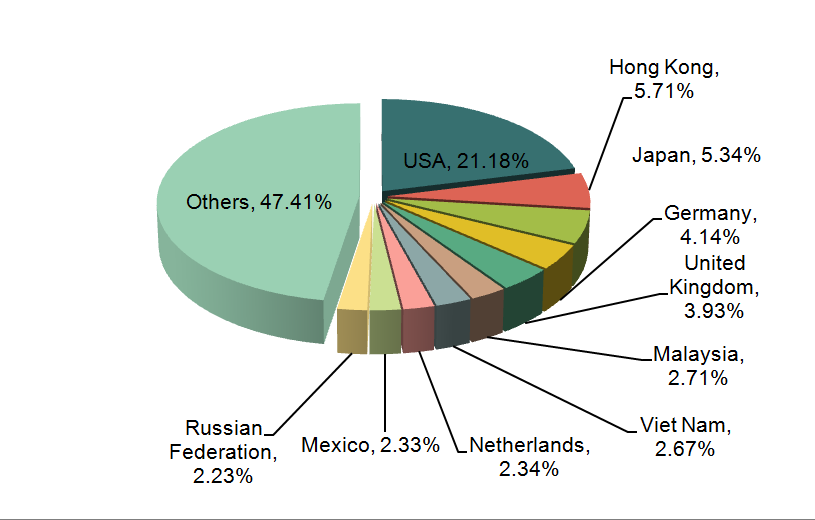
China's total export quantity and value of ballpoint pencil, markers & parts in 2013 amounted to 15.455 billion and 1754 million US dollars, and the export quantity was the same as that in 2012, while the export value increased by 3.9% YOY. China’s ballpoint pencil, markers & parts main export markets were the United States, Hong Kong, Japan, Germany, the United Kingdom, Malaysia, Vietnam, the Netherlands, Mexico and the Russian Federation and so on from Jan. to Dec., 2013. The United States was the main export market of our country's ballpoint pencil, markers & parts, and the export value to the United States in 2013 accounted for 21.28% of the total export value of the products.
China Pencil and drawing chalk (HS: 9609) Major Export Countries/Regions, from Jan. to Dec. 2013 (By export value)
| No. | Country/Region | Accumulative total from Jan.-Dec. | Accumulatively compared to the same period of last year | ||
|
|
| Quantity (kg) | Value (USD) | Quantity | Value |
| 1 | USA | 33,219,180 | 117,522,140 | 4% | 14% |
| 2 | Malaysia | 5,487,604 | 25,043,998 | 11.2% | 14.2% |
| 3 | United Kingdom | 4,848,318 | 19,929,937 | 1.6% | 10.5% |
| 4 | Germany | 3,925,324 | 17,376,777 | -15.1% | -13.1% |
| 5 | Pakistan | 2,921,193 | 13,724,071 | 36.1% | 27.6% |
| 6 | Russian Federation | 3,550,498 | 13,221,356 | 79.1% | 68.7% |
| 7 | Japan | 2,201,192 | 13,002,384 | 0.6% | 8.5% |
| 8 | Thailand | 3,149,326 | 12,856,550 | 4.9% | 1.2% |
| 9 | Indonesia | 3,381,078 | 12,362,156 | 6.9% | 10.1% |
| 10 | Italy | 1,637,985 | 12,354,976 | 0.2% | -6.1% |
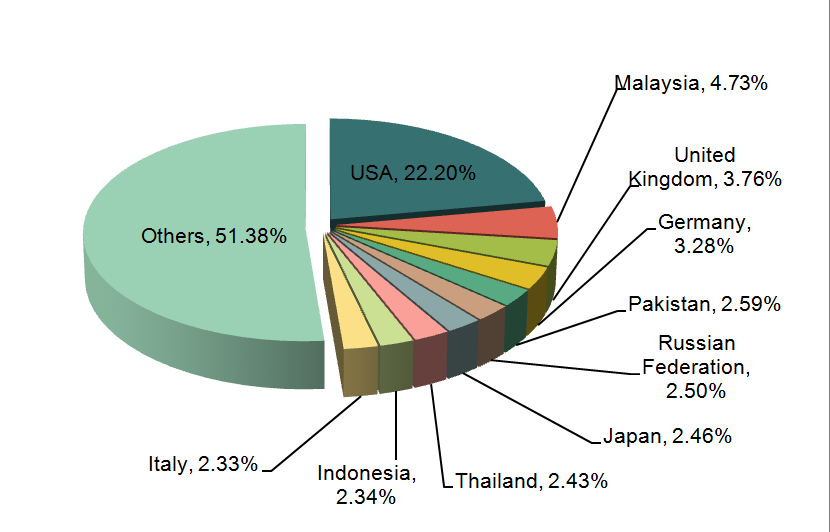
China's total export quantity and value of pencil and drawing chalk in 2013 amounted to 133,600 tons and 529 million US dollars, with an increase of 6.8% and 12.1% compared to the same period of 2012. China’s pencil and drawing chalk main export markets were the United States, Malaysia, the United Kingdom, Germany, Pakistan, the Russian Federation, Japan, Thailand, Indonesia and Italy and so on from Jan. to Dec., 2013. The United States was the main export market of our country's pencil and drawing chalk, and the export value to the United States in 2013 accounted for 22.2% of the total export value of the products.
China Slates & boards, with writing or drawing surfaces (HS: 9610) Major Export Countries/Regions, from Jan. to Dec. 2013 (By export value)
| No. | Country/Region | Accumulative total from Jan.-Dec. | cAccumulatively compared to the same period of last year | ||
|
|
| Quantity (kg) | Value (USD) | Quantity | Value |
| 1 | USA | 28,876,657 | 96,289,695 | -4.9% | -8.3% |
| 2 | Japan | 5,872,477 | 23,678,867 | 12.3% | 13.2% |
| 3 | Netherlands | 5,724,517 | 19,723,719 | 40.5% | 35.3% |
| 4 | United Kingdom | 5,570,288 | 16,681,830 | 15.4% | 11.6% |
| 5 | Germany | 3,768,173 | 15,059,502 | -15.9% | -25.4% |
| 6 | Australia | 3,569,053 | 11,472,829 | 10.8% | 7.5% |
| 7 | Hong Kong | 5,434,054 | 9,455,049 | 22.4% | 90.2% |
| 8 | Malaysia | 1,328,348 | 7,853,345 | 6.5% | 29.2% |
| 9 | United Arab Emirates | 1,822,466 | 7,258,406 | -13.2% | 7.4% |
| 10 | Saudi Arabia | 1,757,624 | 7,009,833 | 1.1% | 1.4% |
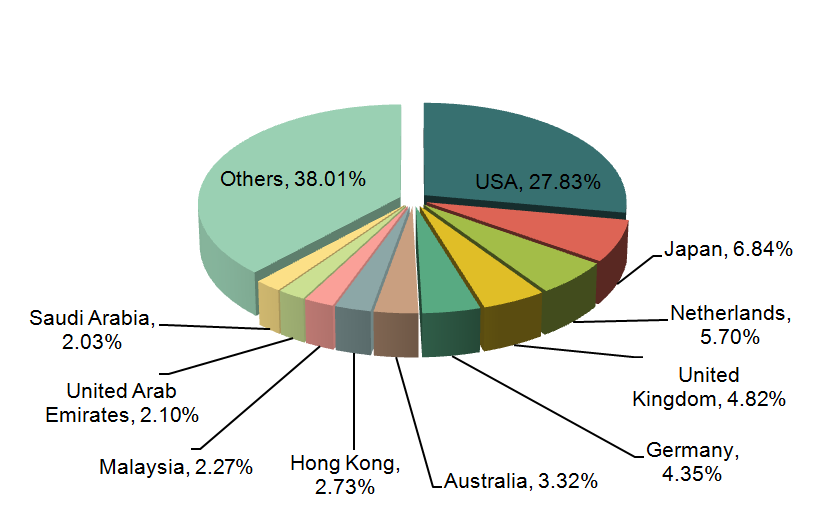
China's total export quantity and value of slates & boards, with writing or drawing surfaces in 2013 amounted to 10,100 tons and 346 million US dollars, with an increase of 4.8% and 5.1% compared to the same period of 2012. China’s slates & boards, with writing or drawing surfaces main export markets were the United States, Japan, the Netherlands, the United Kingdom, Germany, Australia, Hong Kong, Malaysia, the United Arab Emirates and Saudi Arabia and so on from Jan. to Dec., 2013. The United States was the main export market of our country's slates & boards, with writing or drawing surfaces, and the export value to the United States in 2013 accounted for 27.83% of the total export value of the products. Among the top ten slates & boards, with writing or drawing surfaces export markets in 2013, the export value to Hong Kong increased by 90.2% YOY, for the largest increase in value.
China Devices for printing or embossing labels hand-operated (HS: 9611) Major Export Countries/Regions, from Jan. to Dec. 2013 (By export value)
| No. | Country/Region | Accumulative total from Jan.-Dec. | Accumulatively compared to the same period of last year | ||
|
|
| Quantity (kg) | Value (USD) | Quantity | Value |
| 1 | USA | 1,178,378 | 9,532,745 | -17.8% | -13.4% |
| 2 | Hong Kong | 696,299 | 7,873,888 | -58% | 112.4% |
| 3 | Japan | 302,759 | 4,454,339 | -14% | 7.6% |
| 4 | United Kingdom | 295,109 | 2,388,059 | -24.1% | -26.4% |
| 5 | Austria | 164,842 | 2,184,456 | 33.4% | 16.8% |
| 6 | Brazil | 250,419 | 1,622,223 | 20% | 23.1% |
| 7 | Netherlands | 193,317 | 1,573,208 | 58.5% | 36.6% |
| 8 | Malaysia | 255,602 | 1,369,444 | 23.1% | 45.1% |
| 9 | Germany | 152,268 | 1,235,625 | -15.5% | -14.8% |
| 10 | India | 175,719 | 1,138,812 | 40% | 60.8% |
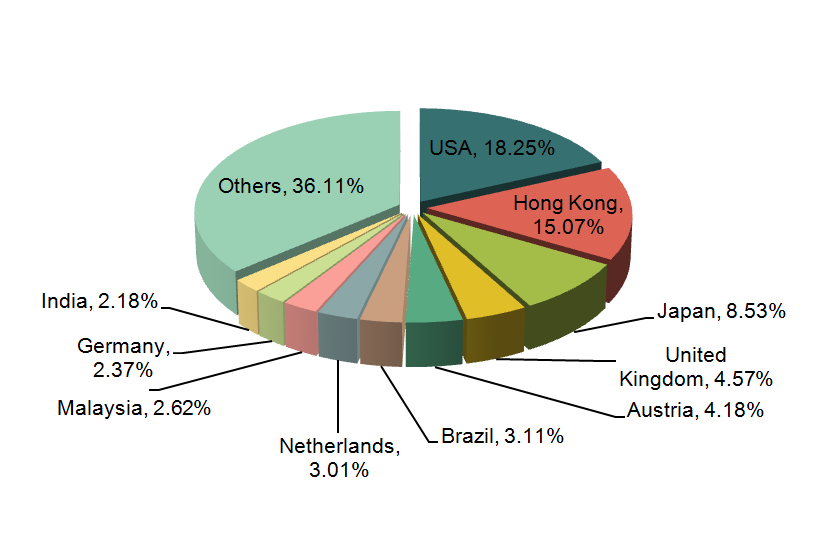
China's total export quantity and value of devices for printing or embossing labels hand-operated in 2013 amounted to 6089 tons and 52 million US dollars, with a year-on-year decrease of 16.1% in export quantity and a year-on-year increase of 3.9% in export value. China’s devices for printing or embossing labels hand-operated main countries/regions were the United States, Hong Kong, Japan, the United Kingdom, Austria, Brazil, the Netherlands, Malaysia, Germany and India and so on from Jan. to Dec., 2013. The United States and Hong Kong were the main export markets of our country's devices for printing or embossing labels hand-operated, and the export value to the United States and Hong Kong in 2013 accounted for 18.25% and 15.07% respectively of the total export value of the products. Among the top ten devices for printing or embossing labels hand-operated export markets in 2013, the export value to Hong Kong increased by 112.4% YOY, for the largest increase in value.
China Typewriter & similar ribbons; ink pads (HS: 9612) Major Export Countries/Regions, from Jan. to Dec. 2013 (By export value)
| No. | Country/Region | Accumulative total from Jan.-Dec. | Accumulatively compared to the same period of last year | ||
|
|
| Quantity (set) | Value (USD) | Quantity | Value |
| 1 | Hong Kong | 47,176,328 | 43,016,473 | -1.9% | 4.7% |
| 2 | Japan | 34,794,766 | 29,182,236 | 1.6% | -5.3% |
| 3 | USA | 28,601,198 | 28,820,837 | -16.9% | -5.7% |
| 4 | Germany | 4,798,152 | 11,665,196 | -34.3% | -23.9% |
| 5 | Singapore | 4,836,984 | 6,919,785 | -2.8% | 0.8% |
| 6 | France | 5,528,864 | 6,656,339 | -15% | -1.7% |
| 7 | Netherlands | 4,905,897 | 6,314,082 | 3.9% | 3.9% |
| 8 | India | 1,091,958 | 5,689,426 | -30.6% | 18.5% |
| 9 | Thailand | 1,676,851 | 4,341,708 | -11.2% | 45% |
| 10 | Malaysia | 3,152,885 | 4,274,461 | -23.8% | -26.9% |
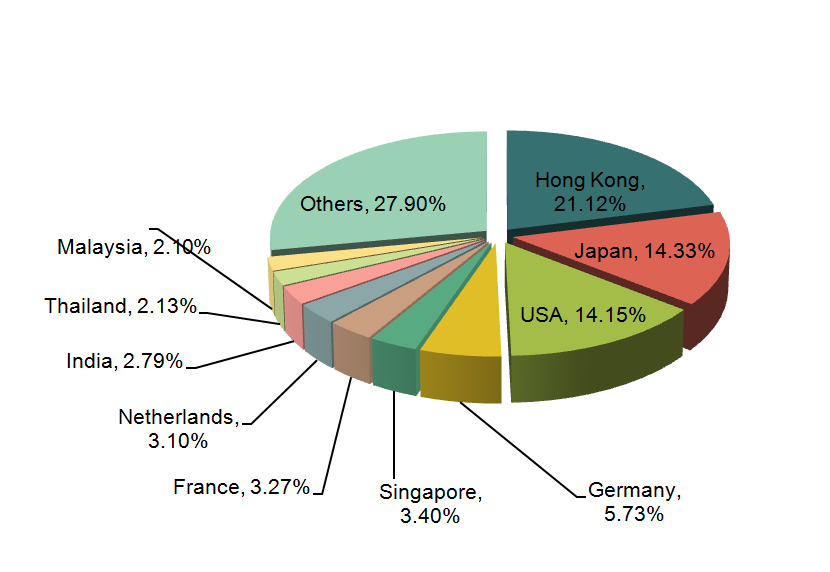
China's total export quantity and value of typewriter & similar ribbons; ink pads in 2013 amounted to 192 million and 204 million US dollars, with a slight decrease of 1% and 0.1% compared to the same period of 2012. China’s typewriter & similar ribbons; ink pads main export countries/regions were Hong Kong, Japan, the United States, Germany, Singapore, France, the Netherlands, India, Thailand and Malaysia and so on from Jan. to
Dec., 2013. Hong Kong, Japan and the United States were the main export markets of our country's typewriter & similar ribbons; ink pads, and the export value to the three markets in 2013 accounted for 21.12%, 14.33% and 14.15% of the total export value of the products respectively.
Source: Customs Information Network


