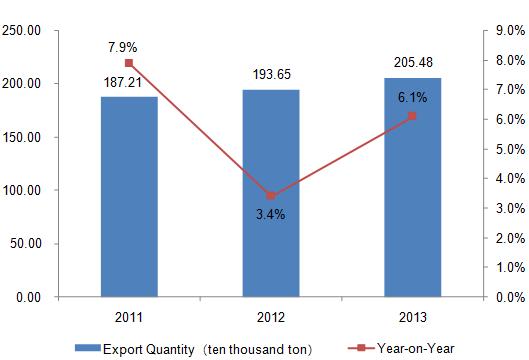
2011-2013 Chinese Electric Wire and Cable Export Volume Trend

From 2011 to 2013, the export volume of Chinese electric wire and cable increased year by year. In 2013, the export volume amounted to 2.0548 million tons, which increased 6.1% compared to the same period of 2012.
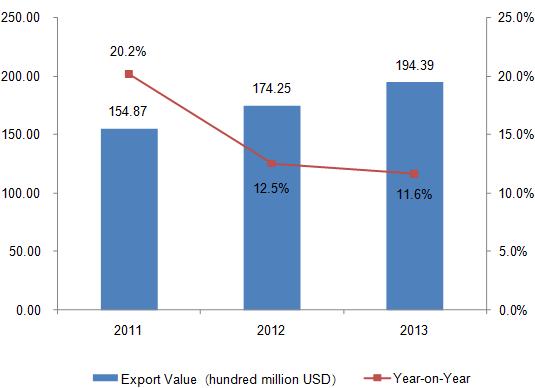
2011-2013 Chinese Electric Wire and Cable Export Value Trend

From 2011 to 2013, the export value of Chinese electric wire and cable increased year by year, as same as the export volume trend shown in the above chart. In 2013, the export value amounted to 19.439 billion dollars, which increased 11.6% compared to the same period of 2012
2011-2013 Chinese Electric Wire and Cable Export Market Analysis
| No. | Countries/Regions | Export Value ($) | Export Value Growth Compared 2013 with 2011 | ||
| 2011 | 2012 | 2013 | |||
| 1 | Hong Kong | 2,296,195,448 | 2,841,199,647 | 3,829,430,926 | 66.77% |
| 2 | USA | 2,297,024,922 | 2,737,791,719 | 3,111,273,222 | 35.45% |
| 3 | Japan | 2,335,878,857 | 2,651,752,618 | 2,516,732,616 | 7.74% |
| 4 | Republic of Korea | 1,359,534,315 | 1,407,464,312 | 1,507,886,498 | 10.91% |
| 5 | Australia | 482,488,737 | 489,634,753 | 533,722,138 | 10.62% |
| 6 | Singapore | 301,521,603 | 406,157,951 | 423,222,681 | 40.36% |
| 7 | Thailand | 276,710,259 | 331,716,126 | 385,819,783 | 39.43% |
| 8 | Germany | 364,969,717 | 357,798,871 | 373,456,392 | 2.33% |
| 9 | Indonesia | 289,150,445 | 313,983,187 | 370,748,321 | 28.22% |
| 10 | Malaysia | 176,420,910 | 290,295,823 | 364,081,099 | 106.37% |
| 11 | United Kingdom | 305,694,996 | 319,399,879 | 344,179,396 | 12.59% |
| 12 | Viet Nam | 240,187,103 | 306,544,891 | 343,747,768 | 43.12% |
| 13 | India | 421,284,362 | 350,164,143 | 315,687,864 | -25.07% |
| 14 | United Arab Emirates | 184,357,767 | 194,835,611 | 270,552,409 | 46.75% |
| 15 | Philippines | 164,387,822 | 205,678,671 | 242,510,723 | 47.52% |
| 16 | Canada | 263,316,560 | 313,318,370 | 241,873,607 | -8.14% |
| 17 | Brazil | 169,663,508 | 186,720,568 | 222,505,283 | 31.15% |
| 18 | Russian Federation | 195,548,573 | 193,551,093 | 205,896,189 | 5.29% |
| 19 | Taiwan | 276,763,517 | 230,912,044 | 203,615,177 | -26.43% |
| 20 | Netherlands | 192,558,391 | 203,599,850 | 203,476,781 | 5.67% |
The first three largest export markets were Hong Kong, USA and Japan from 2011 to 2013. Japan, which used to rank the fourth place in 2012, was the second largest export market in 2013, surmounted United Kingdom and Saudi Arabia. Among the above twenty export markets in 2013, the export value to Malaysia showed the largest increase of 106.37%, compared to 2011. The export value to India, Canada and Taiwan declined 25.07%, 8.14% and 26.43% respectively, compared to 2011.
2011-2013 Chinese Electric Wire and Cable Export Market Share Analysis
| No. | Countries/Regions | Value Percentage | ||
| 2011 | 2012 | 2013 | ||
| 1 | Hong Kong↑ | 14.83% | 16.30% | 19.70% |
| 2 | USA↑ | 14.83% | 15.71% | 16.00% |
| 3 | Japan | 15.08% | 15.22% | 12.95% |
| 4 | Republic of Korea↓ | 8.78% | 8.08% | 7.76% |
| 5 | Australia↓ | 3.12% | 2.81% | 2.75% |
| 6 | Singapore | 1.95% | 2.33% | 2.18% |
| 7 | Thailand↑ | 1.79% | 1.90% | 1.98% |
| 8 | Germany↓ | 2.36% | 2.05% | 1.92% |
| 9 | Indonesia | 1.87% | 1.80% | 1.91% |
| 10 | Malaysia↑ | 1.14% | 1.67% | 1.87% |
| 11 | United Kingdom↓ | 1.97% | 1.83% | 1.77% |
| 12 | Viet Nam↑ | 1.55% | 1.76% | 1.77% |
| 13 | India↓ | 2.72% | 2.01% | 1.62% |
| 14 | United Arab Emirates | 1.19% | 1.12% | 1.39% |
| 15 | Philippines↑ | 1.06% | 1.18% | 1.25% |
| 16 | Canada | 1.70% | 1.80% | 1.24% |
| 17 | Brazil | 1.10% | 1.07% | 1.14% |
| 18 | Russian Federation↓ | 1.26% | 1.11% | 1.06% |
| 19 | Taiwan↓ | 1.79% | 1.33% | 1.05% |
| 20 | Netherlands↓ | 1.24% | 1.17% | 1.05% |
Judging from the changing trend of the export market share from 2011 to 2013, the countries and regions whose market share continued to rise were Hong Kong, USA, Thailand, Malaysia, Viet Nam and Philippines. While, the countries and regions whose market share continued to decline were Republic of Korea, Australia, Germany, United Kingdom, India, Russian Federation, Taiwan and Netherlands.
Source: China Customs


