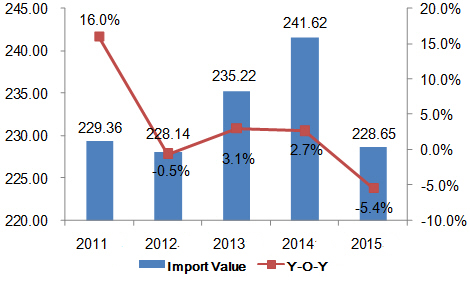
Annual Export Trends of Global Portable Tools

From 2011 to 2015, export value of global portable tools were USD 2,293,600,000, USD 2,281,000,000, USD 2,352,000,000, USD 2,416,000,000, USD 2,286,500,000. The export value in 2015 fell 5.4% on year, growing 0.2% on 2012
Top Portable Tools Importers
| No. | Importer | Import Value(USD) | on Year |
| 1 | United States | 5,161,389 | 12.00% |
| 2 | Canada | 757,549 | -11.10% |
| 3 | Australia | 558,288 | -9.40% |
| 4 | Japan | 454,488 | -10.30% |
| 5 | Korea | 321,880 | -5.30% |
| 6 | Swiss | 290,800 | -14.40% |
| 7 | Turkey | 241,995 | -0.30% |
| 8 | Brazil | 284,314 | -14.30% |
| 9 | New Zealand | 100,363 | -7.40% |
| 10 | Chile | 107,674 | -3.80% |
The top portable tools importers were the United States, Canada and Australia in 2015. .
Top Portable Tools Exporters
| No. | Exporter | Export Value(USD) | on Year |
| 1 | China | 8,582,809 | -2.30% |
| 2 | Germany | 2,973,995 | -11.50% |
| 3 | United States | 1,319,128 | -11.50% |
| 4 | Mexico | 820,819 | 34.50% |
| 5 | Belgium | 800,929 | -15.00% |
| 6 | Taiwan | 693,547 | 1.10% |
| 7 | Japan | 690,523 | -12.30% |
| 8 | Sweden | 681,233 | -0.70% |
| 9 | Austria | 567,316 | -9.10% |
| 10 | Singapore | 345,891 | 2.60% |
The top exporters of hand saws were China, Germany and the United States in 2015.
Source:


