Export Quantity & Value for Chinese Blow Molding Machines in the First Half of 2012
| Month | Export Quantity(Unit) | Export Value(USD Million) | Year on Year (±%) | |
| Quantity | Value | |||
| Jan. | 1,876 | 15.5 | 111.3 | 23.2 |
| Feb. | 264 | 8.0 | -32.7 | 9.5 |
| Mar. | 567 | 10.4 | 15.7 | -8.2 |
| Apr. | 497 | 10.4 | 1 | -10.3 |
| May | 670 | 14.5 | 6.2 | 25 |
| Jun. | 4,083 | 12.9 | 611.3 | -4.5 |
| Total | 7,957 | 71.7 | 129.5 | 5.6 |
Major Importers for Chinese Blow Molding Machines in the first half of 2012
| No. | Countries/Regions | The First Half of 2012 | Year on Year (±%) | ||
| Export Quantity (Ton) | Export Value(USD Thousand) | Quantity | Value | ||
| 1 | Thailand | 130 | 4,527 | 42.9 | 33.5 |
| 2 | Vietnam | 169 | 4,327 | 5 | 31.8 |
| 3 | India | 160 | 3,990 | 48.1 | 78.6 |
| 4 | Indonesia | 129 | 3,268 | -9.2 | -3.8 |
| 5 | USA | 59 | 3,259 | -43.8 | 44.4 |
| 6 | Japan | 36 | 3,253 | 500 | 178.6 |
| 7 | Russian Federation | 127 | 2,646 | 33.7 | 26.6 |
| 8 | Malaysia | 106 | 2,351 | -10.2 | 5.7 |
| 9 | Brazil | 45 | 1,984 | -43 | -10.6 |
| 10 | Nigeria | 211 | 1,886 | 16.6 | -15.4 |
| 11 | HK | 46 | 1,755 | 119 | 125 |
| 12 | France | 10 | 1,652 | 0 | 0 |
| 13 | Egypt | 147 | 1,519 | 23.5 | -14.4 |
| 14 | South Africa | 52 | 1,492 | -60.9 | -11.7 |
| 15 | Saudi Arabia | 91 | 1,356 | 46.8 | -43 |
| 16 | Chile | 36 | 1,303 | 16.1 | 4.7 |
| 17 | Iran | 92 | 1,282 | -39.9 | -76.8 |
| 18 | Ukraine | 15 | 1,208 | -57.1 | 143.5 |
| 19 | Burma | 52 | 1,147 | 0 | 188.2 |
| 20 | Algeria | 200 | 1,138 | 63.9 | 48 |
Major Cities/Provinces for Chinese Blow Molding Machines Export in the first half of 2012
| No. | City/Province | The First Half of 2012 | Year on Year (±%) | Proportion of Export Value (%) | ||
| Export Quantity (Unit) | Export Value (USD Thousand) | Quantity | Value | |||
| 1 | Zhejiang | 3,334 | 28,503 | 62.2 | 4.3 | 39.74% |
| 2 | Guangdong | 461 | 14,996 | -21.7 | -13.2 | 20.91% |
| 3 | Jiangsu | 253 | 9,232 | 1.2 | -4.9 | 12.87% |
| 4 | Beijing | 9 | 5,732 | 0 | 223.1 | 7.99% |
| 5 | Shanghai | 3,594 | 4,296 | 2971.8 | 16.8 | 5.99% |
In the first half of 2012, Chinese blow molding machines achieved an export quantity of 7,957 units in total, with a rise of 129.5% year on year; and the export value reached 0.72 billion dollars, up 5.6% year on year.
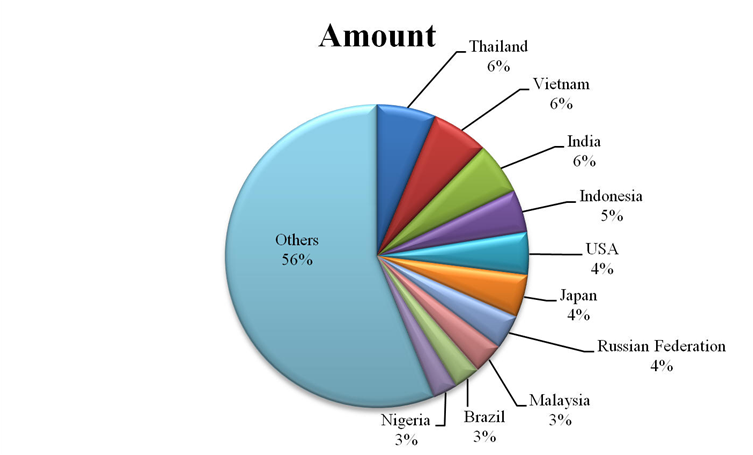
The major importers were Thailand, Vietnam, India, Indonesia, USA, Japan, Russian Federation, Malaysia, Brazil and Nigeria and so on. In the first half of 2012, Chinese blow molding machines export value for Thailand accounted for 6.31% of the total export value of Chinese blow molding machines.
The Major cities/provinces of export source of Chinese blow molding machines were as follows: Zhejiang, Guangdong, Jiangsu and Shanghai, in which Zhejiang’s cumulative export value of Chinese blow molding machines occupied 39.735% of the total export value of Chinese blow molding machines.


