China Daily Chemical Industry Export Trend Analysis
| HS Code | Product Name |
| 3401 | Soap; organic surface-active products and preparations for use as soap, in the form of bars, cakes, molded pieces or shapes, whether or not containing soap; organic surface-active products and preparations for washing the skin, in the form of liquid or cream and put up for retail sale, whether or not containing soap; paper, wadding, felt and nonwovens, impregnated, coated or covered with soap or detergent, the following text referred as "soap" |
| 3402 | Organic surface-active agents (other than soap); surface-active preparations, washing preparations (including auxiliary washing preparations) and cleaning preparations, whether or not containing soap, other than those of heading No.34. 01, the following text referred as "washing preparations" |
China Soap (HS:3401) Export Volume and Value from Jan. to June in 2013
| Month | Volume (10000 tons) | Value (Hundred Million USD) | Year on Year | |
| Volume | Value | |||
| January | 2.33 | 0.42 | 12.9% | 25.4% |
| February | 1.74 | 0.31 | 50.6% | 54.4% |
| March | 2.10 | 0.38 | 6.8% | 6.3% |
| April | 2.37 | 0.43 | 13.2% | 13.8% |
| May | 2.52 | 0.46 | 7.8% | 7.2% |
| June | 2.14 | 0.39 | -5.3% | -3.7% |
| Jan. - Jun. Total | 13.21 | 2.40 | 11.2% | 13.6% |
The export value of China soap amounted to 240 million dollars in the first half of 2013, with an increase of 13.6%.
China Soap (HS: 3401) Main Export Country/Region Distribution from Jan. to Jun. in 2013
| No. | Country | Volume (Kilo) | Value (USD) | Year on Year | |
| Volume | Value | ||||
| 1 | USA | 32,219,033 | 53,920,086 | 14.4% | 11.9% |
| 2 | Japan | 15,728,773 | 34,104,478 | 16.8% | 12.5% |
| 3 | Australia | 11,993,221 | 22,150,300 | 33.0% | 25.8% |
| 4 | UK | 8,042,017 | 14,637,433 | 12.9% | 14.5% |
| 5 | Hong Kong | 6,410,697 | 12,822,373 | -3.0% | 17.0% |
| 6 | South Korea | 5,177,323 | 6,730,189 | -0.1% | -0.4% |
| 7 | Cuba | 5,869,588 | 6,084,067 | 50.3% | 19.2% |
| 8 | Philippines | 2,867,243 | 5,605,877 | 45.1% | 97.0% |
| 9 | Malaysia | 1,295,481 | 4,450,443 | -10.3% | 59.0% |
| 10 | Indonesia | 1,799,370 | 4,184,251 | 83.7% | 111.0% |
| 11 | North Korea | 5,337,689 | 4,057,316 | -14.6% | -16.0% |
| 12 | South Africa | 2,116,547 | 3,926,145 | 40.9% | 34.0% |
| 13 | Benin | 1,634,186 | 3,484,466 | 13.7% | 23.8% |
| 14 | Canada | 1,529,174 | 3,335,490 | -22.2% | -14.8% |
| 15 | New Zealand | 2,095,190 | 3,267,510 | -6.1% | -7.6% |
| 16 | Taiwan | 1,261,543 | 3,191,286 | 11.2% | -5.1% |
| 17 | Netherlands | 1,366,440 | 3,050,350 | 6.0% | 26.4% |
| 18 | Singapore | 1,041,516 | 2,326,745 | -13.1% | 8.3% |
| 19 | UAE | 972,243 | 2,188,123 | 7.2% | 47.1% |
| 20 | The Russian Federation | 1,001,493 | 1,979,532 | 35.7% | 26.0% |
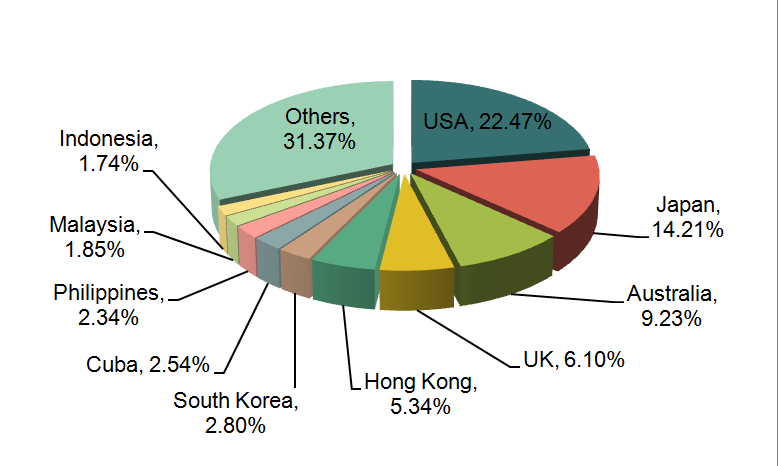
In the first half of 2013, among the top twenty export destination country/region, there is a larger increase in Indonesia (with an increase of 111%) and Philippines (with an increase of 97%) seen from the export value in proportion.
The world's largest factory of L'Oreal Group is located in Indonesia. The factory with building area of 66,000 square meters is located in Jababeka Industrial Estate, West Java, Indonesia, which is about 60 kilometers away from the east of Jakarta. The total investment amounts to 100 million Euros. This new factory is L'Oreal production hub in Southeast Asia and to promote the Indonesian industry, in particular the cosmetics industry development.
China Soap (HS:3401) Export Source Area from Jan. to Jun. in 2013
| No. | Region | Volume (Kilo) | Value (USD) | Year on Year | |
| Volume | Value | ||||
| 1 | Zhejiang | 32,356,948 | 53,731,741 | 10.6% | 12.5% |
| 2 | Guangdong | 19,750,619 | 48,701,834 | 2.0% | 16.0% |
| 3 | Jiangsu | 25,030,903 | 41,945,368 | 12.9% | 15.1% |
| 4 | Shanghai | 14,431,217 | 25,985,782 | 12.2% | 9.3% |
| 5 | Hubei | 10,082,509 | 20,058,558 | 2.7% | -7.3% |
| 6 | Anhui | 7,225,118 | 12,598,836 | 31.2% | 30.3% |
| 7 | Fujian | 3,943,573 | 9,501,354 | -24.5% | 6.7% |
| 8 | Tianjin | 6,317,223 | 7,617,971 | 150.8% | 118.1% |
| 9 | Hebei | 8,229,857 | 7,603,965 | 18.3% | 38.4% |
| 10 | Liaoning | 2,547,386 | 5,546,049 | -21.1% | -10.7% |
Zhejiang, Guangdong and Jiangsu are Chinese soap main export source areas. In the first half of 2013, among the top ten export source areas of Chinese soap, there is a larger increase of export volume in Tianjin. The export volume increased of 150.8% year on year, while the export value increased of 118.1%.
Tianjin synthetic detergent production as an example, the production statistics of Jan. to July in 2013 are as follows:
| July Production (T) | The Grand Total from Jan. to July (T) | Year-on-Year Growth in July | The Grand Total of Year-on-Year Growth from Jan. to July |
| 8,572.00 | 29,391.91 | 269.8% | 285.06% |
China Washing Preparations (HS:3402) Export Volume and Value from Jan. to June in 2013
| Month | Volume (10000 tons) | Value (Hundred Million USD) | Year on Year | |
| Volume | Value | |||
| January | 9.29 | 1.35 | 19.3% | 30.7% |
| February | 6.92 | 1.08 | 7.6% | 19.3% |
| March | 10.74 | 1.59 | 19.8% | 26.6% |
| April | 10.17 | 1.44 | 11.1% | 9.2% |
| May | 10.71 | 1.45 | 14.0% | -1.3% |
| June | 9.46 | 1.28 | 12.2% | -2.6% |
| Jan. - Jun. Total | 57.30 | 8.19 | 14.2% | 12.2% |
The export value of China Washing Preparations amounted to 819 million dollars in the first half of 2013, with an increase of 12.2%.
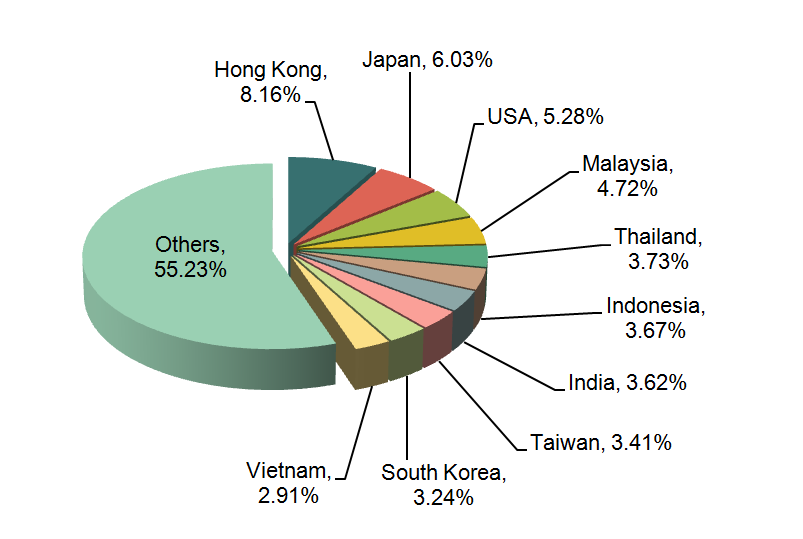
China Washing Preparations (HS:3402) Main Export Country/Region Distribution from Jan. to June in 2013
| No. | Country | Volume (Kilo) | Value (USD) | Year on Year | |
| Volume | Value | ||||
| 1 | Hong Kong | 52,488,322 | 66,854,631 | 13.7% | 30.8% |
| 2 | Japan | 30,232,613 | 49,404,864 | -0.4% | 0.3% |
| 3 | USA | 22,140,728 | 43,234,385 | -22.4% | -24.6% |
| 4 | Malaysia | 24,268,377 | 38,681,426 | 22.8% | 48.2% |
| 5 | Thailand | 12,772,619 | 30,570,427 | 0.4% | 2.1% |
| 6 | Indonesia | 15,923,214 | 30,055,491 | 30.8% | 34.3% |
| 7 | India | 11,627,721 | 29,640,941 | -0.3% | 26.9% |
| 8 | Taiwan | 25,856,171 | 27,897,539 | -1.5% | -7.8% |
| 9 | South Korea | 21,275,937 | 26,572,463 | 19.6% | 38.5% |
| 10 | Vietnam | 11,710,577 | 23,811,680 | 36.0% | 34.1% |
| 11 | UK | 9,256,527 | 22,638,000 | 14.8% | 5.9% |
| 12 | Singapore | 10,470,650 | 20,348,630 | 1.2% | -2.1% |
| 13 | Australia | 11,993,063 | 18,887,953 | 19.8% | 20.5% |
| 14 | Philippines | 10,242,370 | 17,438,330 | -19.5% | -12.6% |
| 15 | UAE | 9,705,253 | 17,304,892 | 11.7% | 2.9% |
| 16 | Ghana | 17,443,210 | 16,633,401 | 38.5% | 35.3% |
| 17 | Togo | 18,444,644 | 15,927,153 | 50.4% | 61.8% |
| 18 | Kazakhstan | 3,554,511 | 14,738,881 | 15.4% | 9.0% |
| 19 | Pakistan | 12,297,954 | 14,309,915 | 22.9% | 0.7% |
| 20 | Iran | 11,961,377 | 12,158,331 | 238.4% | 107.9% |
In the first half of 2013, among the top twenty export destination country/region, there was a larger increase of export volume in Iran (with an increase of 238.4%) and the export value increased of 107.9% year on year. The development of Iran daily chemical market benefited from the increase of population, economic growth and people's disposable income.
China Washing Preparations (HS:3402) Export Source Area from Jan. to Jun. in 2013
| No. | Region | Volume (Kilo) | Value (USD) | Year on Year | |
| Volume | Value | ||||
| 1 | Guangdong | 149,310,159 | 217,776,281 | 26.1% | 38.7% |
| 2 | Jiangsu | 92,327,034 | 196,366,653 | 7.5% | 1.6% |
| 3 | Shandong | 124,215,044 | 99,689,672 | 19.0% | 3.5% |
| 4 | Zhejiang | 76,317,639 | 89,995,833 | 2.8% | -3.0% |
| 5 | Shanghai | 35,726,861 | 69,765,717 | 7.4% | 3.0% |
| 6 | Anhui | 27,049,183 | 25,179,907 | 7.8% | 34.2% |
| 7 | Beijing | 3,621,012 | 17,801,875 | -12.1% | 12.2% |
| 8 | Fujian | 12,260,033 | 17,088,200 | -6.1% | -5.6% |
| 9 | Hubei | 10,184,221 | 16,165,556 | 92.5% | 53.3% |
| 10 | Tianjin | 11,195,098 | 15,371,246 | 42.5% | 27.1% |
Guangdong and Jiangsu are Chinese Washing Preparations main export source areas. In the first half of 2013, among the top ten export source areas of Chinese soap, there is a larger increase of export volume in Hubei, with an increase of 92.5%.
(Source: China Customs Network)


")
")