2009-2011 Chinese Valve Industry Export Situation
Note:
HS: 8481, used for pipes, boilers, tanks, vats or the similar products, taps, cocks, valves and some similar devices, including pressure reducing valves and thermostatically controlled valves, hereinafter referred to as "valves".
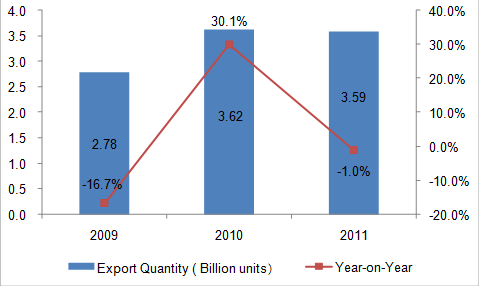
2009-2011 Chinese Valve(HS:8481)Export Quantity Trend

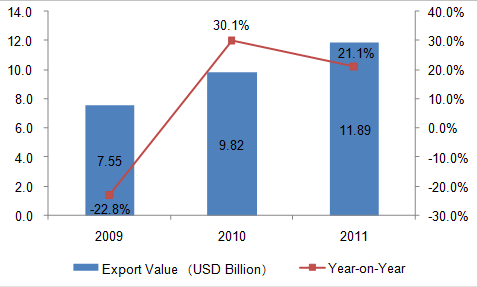
2009-2011 Chinese Valve(HS:8481)Export Value Trend

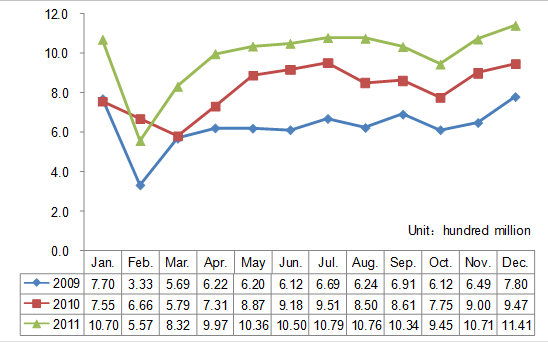
2009-2011 Chinese Valve(HS:8481)Export Value Monthly Trend

From 2009 to 2011, the total export value of Chinese valve appears inverted "V" shape with year by year increasing. The total export volume in 2011 approximately reached 3.59 billion units with a decline of 1%; the total export value approximately reached 11.89 billion dollars with a year on year increase of 21.1%. From the chart form of Chinese valve monthly export volume in 2009-2011, we could find there is a seasonal trend of valves exporting. Feb. is trough and the significant growth is in Nov. and Dec.
2009-2011 Chinese Valve(HS:8481)Major Export Countries/Regions
| Item | Export Countries/Regions | Export Values(USD) | 2011 Export Growth Rate compared with 2009 | ||
| Year 2009 | Year 2010 | Year 2011 | |||
| 1 | USA | 1,678,266,041 | 2,168,573,247 | 2,708,580,480 | 61.39% |
| 2 | Japan | 386,206,863 | 505,710,929 | 675,501,407 | 74.91% |
| 3 | Germany | 384,541,971 | 539,179,686 | 600,558,142 | 56.17% |
| 4 | The United Kingdom | 333,257,943 | 446,947,661 | 502,396,282 | 50.75% |
| 5 | Russian Federation | 207,731,921 | 353,876,566 | 452,267,851 | 117.72% |
| 6 | Italy | 299,348,021 | 351,425,700 | 370,509,867 | 23.77% |
| 7 | Republic of Korea | 240,395,290 | 283,185,031 | 349,500,517 | 45.39% |
| 8 | Spain | 257,549,494 | 301,606,306 | 311,737,553 | 21.04% |
| 9 | Canada | 152,102,914 | 214,376,502 | 300,386,755 | 97.49% |
| 10 | Hong Kong | 209,352,750 | 261,836,017 | 284,699,723 | 35.99% |
| 11 | France | 189,899,713 | 256,705,849 | 268,710,913 | 41.50% |
| 12 | India | 145,268,780 | 194,021,522 | 257,701,362 | 77.40% |
| 13 | Australia | 152,829,079 | 196,988,635 | 243,878,430 | 59.58% |
| 14 | Chinese Taipei | 127,119,830 | 188,073,529 | 239,310,045 | 88.26% |
| 15 | The United Arab Emirates | 169,566,066 | 203,121,140 | 233,600,012 | 37.76% |
| 16 | Thailand | 111,425,955 | 162,064,366 | 193,833,543 | 73.96% |
| 17 | The Netherlands | 111,168,290 | 139,667,283 | 187,912,414 | 69.03% |
| 18 | Indonesia | 144,692,009 | 148,841,737 | 172,094,950 | 18.94% |
| 19 | Mexico | 104,213,716 | 140,519,915 | 171,376,423 | 64.45% |
| 20 | Saudi Arabia | 118,407,085 | 119,288,724 | 165,860,350 | 40.08% |
From 2009 to 2011, Chinese valve mainly exported to USA, Japan, Germany, the United Kingdom, Russian Federation, Italy, Republic of Korea, Spain, Canada and Hong Kong, among these, Russian Federation has become the fastest growing country in importing Chinese valves, in 2011 the total export volume approximately reached 452 million dollars, with an increase of 117.72 compared to year 2011.
2009-2011 Chinese Valve(HS:8481)Major Export Countries/Regions and Market Share Trend
| Item |
| Market Share of Export Value | ||
|
|
| Year 2009 | Year 2010 | Year 2011 |
| 1 | USA | 22.23% | 22.08% | 22.78% |
| 2 | Japan↑ | 5.12% | 5.15% | 5.68% |
| 3 | Germany | 5.09% | 5.49% | 5.05% |
| 4 | The United Kingdom | 4.41% | 4.55% | 4.23% |
| 5 | Russian Federation↑ | 2.75% | 3.60% | 3.80% |
| 6 | Italy↓ | 3.96% | 3.58% | 3.12% |
| 7 | Republic of Korea | 3.18% | 2.88% | 2.94% |
| 8 | Spain↓ | 3.41% | 3.07% | 2.62% |
| 9 | Canada↑ | 2.01% | 2.18% | 2.53% |
| 10 | Hong Kong↓ | 2.77% | 2.67% | 2.39% |
| 11 | France | 2.52% | 2.61% | 2.26% |
| 12 | India↑ | 1.92% | 1.98% | 2.17% |
| 13 | Australia | 2.02% | 2.01% | 2.05% |
| 14 | Chinese Taipei↑ | 1.68% | 1.92% | 2.01% |
| 15 | The United Arab Emirates↓ | 2.25% | 2.07% | 1.97% |
| 16 | Thailand | 1.48% | 1.65% | 1.63% |
| 17 | The Netherlands | 1.47% | 1.42% | 1.58% |
| 18 | Indonesia↓ | 1.92% | 1.52% | 1.45% |
| 19 | Mexico↑ | 1.38% | 1.43% | 1.44% |
| 20 | Saudi Arabia | 1.57% | 1.21% | 1.40% |
Note: ↑mean that from 2009 to 2011, the total export amount of certain countries kept rising in the proportion of China’s total export amount. ↓ mean that from 2009 to 2011, the export amount to the certain countries continued to decline in the proportion of China’s total export amount.
According to the trend of export market share from 2009 to 2011, Japan, the Russian Federation, Canada, India, Chinese Taipei and Mexico have become the continued growth countries; Italy, Spain, Hong Kong, United Arab Emirates and Indonesia continued to decline.


