Exports Situation of the Main Chinese Packaging Machinery Products from Jan. to Aug. in 2012
According to customs statistics, from Jan. to Aug. in 2012, Chinese packaging machinery exports were 322 million dollars, a growth of 27.6% year-on-year. Beverage and liquid food canning equipment exports Were 141 million dollars, an increase of 38.5%, accounting for 43.81%, ranked the first. Followed by other filling machines, packaging machines, whose exports were 113 million dollars, a growth of 15.9% compared with the last year, accounting for 35.27%.
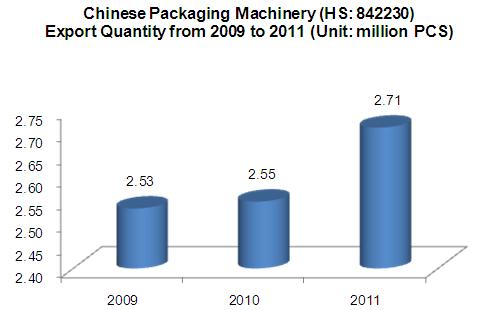
Chinese Packaging Machinery (HS: 842230) Export Quantity Trend from 2009 to 2011
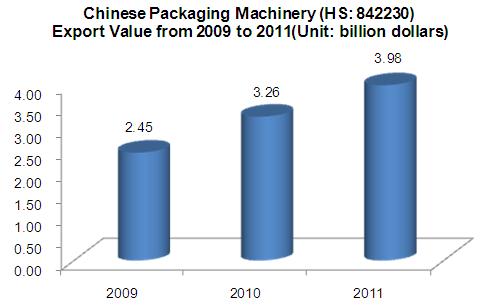
Chinese Packaging Machinery (HS: 842230) Export Value Trend from 2009 to 2011
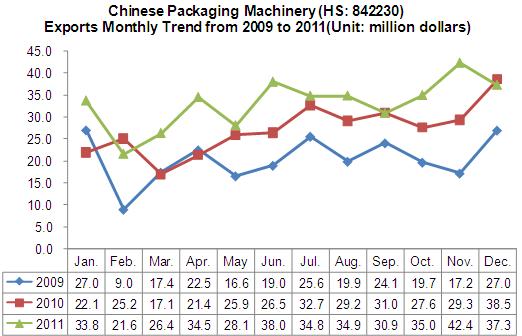
Chinese Packaging Machinery (HS: 842230) Exports Monthly Trend from 2009 to 2011
From 2009 to 2011, China's total exports of packaging machinery showed a trend of increase, the total export value increased year by year, in 2011 the total exports quantity were about 2.71 million units, an increase of 6.4% year on year; The exports value amounted to approximately 398 million dollars, an increase of 21.8% compared with the previous year.
From the chat can be seen that exports value in the second half of this year was higher than the first half of the year. February and March was the annual export trough.
China's Packaging Machinery (HS: 842230) Export Situation in 2012
Export Quantity and Value of Chinese Packaging Machinery (HS: 842230) from Jan. to Aug. in 2012
| Mouth | Quantity(PCS) | Value(dollars) | Year-on-Year±% | |
| Quantity | Value | |||
| Jan. | 242,178 | 44,288,560 | -7.2 | 31.2 |
| Feb. | 96,924 | 26,990,635 | -20.1 | 25 |
| Mar. | 181,029 | 36,665,303 | 35.5 | 39.1 |
| Apr. | 284,623 | 35,100,185 | 80.7 | 1.7 |
| May. | 272,728 | 44,954,038 | 18.5 | 60.1 |
| Jun. | 352,749 | 43,923,066 | 47 | 15.5 |
| Jul. | 321,698 | 42,543,822 | 0.7 | 22.2 |
| Aug. | 355,853 | 47,158,408 | 33.3 | 35.3 |
| Total | 2,107,782 | 321,624,017 | 21.8 | 27.6 |
Chinese packaging machinery exports quantity was about 2.11 million units from Jan. to Aug. in 2012, the export quantity increased by 21.8% year-on-year, the value of exports increased by 27.6% year-on-year.
Major Importers for Chinese Packaging Machinery (HS: 842230) from Jan. to Aug. in 2012
| No. | Importers | Quantity(Million units) | Value(dollars) | Year-on-Year±% | |
| Quantity | Value | ||||
| 1 | USA | 84.1 | 29,765,716 | 7.5 | 1.9 |
| 2 | India | 1.8 | 21,077,240 | 14.9 | 38.2 |
| 3 | Vietnam | 4.1 | 16,813,224 | 213.2 | 24.2 |
| 4 | Indonesia | 4.8 | 16,710,488 | -17.8 | 91.3 |
| 5 | Thailand | 1.8 | 16,109,174 | -13.5 | 93.2 |
| 6 | Algeria | 0.9 | 12,107,688 | 5.5 | 244.6 |
| 7 | Malaysia | 16.7 | 9,882,093 | 197.3 | 41.5 |
| 8 | Nigeria | 3.6 | 9,391,598 | 69.6 | -8.7 |
| 9 | Japan | 5.1 | 8,555,684 | 167.7 | 116.9 |
| 10 | Russian Federation | 5.3 | 8,325,378 | 19.5 | -12.8 |
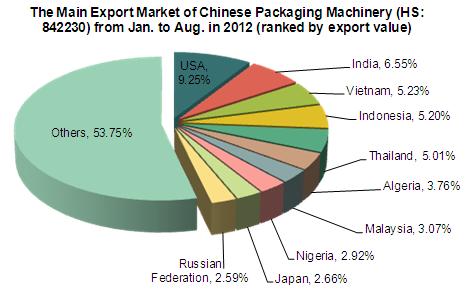
From Jan. to Aug. in 2012, among the top 10 export destination countries, the exports quantity of China's packaging machinery to eight countries increased, while reduced to the other two countries. From the export quantity compared to the same period, Vietnam (up 213.2%), Malaysia (up 197.3%) and Japan (up 167.7%) increased largely, exports fell in Indonesia (down 17.8%) and Thailand (down 13.5%). From the export value compared to the same period, there had a larger increase in Algeria (up 244.6%) and Japan (up 116.9%), however, the exports value in Nigeria (down 8.7%) and the Russian Federation (down 12.8%) declined. It is noteworthy that Algeria and Japan replaced Hong Kong and Iran; ranked the top ten export destination countries of packaging machinery in China.
Major Export Source of Chinese Packaging Machinery (HS: 842230) from Jan. to Aug. in 2012
| No. | Cities/Provinces | Quantity(PCS) | Value(dollars) | Year-on-Year±% | |
| Quantity | Value | ||||
| 1 | Guangdong | 1,283,651 | 87,431,013 | 14.7 | 32.5 |
| 2 | Jiangsu | 10,127 | 81,523,674 | -9.7 | 56.8 |
| 3 | Shanghai | 7,014 | 58,141,747 | -20.8 | 3.1 |
| 4 | Zhejiang | 755,807 | 42,686,801 | 31.8 | 12.7 |
| 5 | Anhui | 1,572 | 10,867,870 | 35.1 | 34.3 |
| 6 | Shandong | 3,443 | 10,207,083 | -2.5 | 77.6 |
| 7 | Beijing | 141 | 5,798,694 | -24.2 | 36.1 |
| 8 | Hebei | 420 | 4,861,635 | -78.3 | 13.4 |
| 9 | Hunan | 63 | 4,609,423 | -94.1 | -16.1 |
| 10 | Liaoning | 513 | 3,806,882 | 57.4 | 51.3 |
| 11 | Tianjin | 432 | 2,321,982 | 51.6 | -17.5 |
| 12 | Fujian | 36,458 | 1,475,087 | 680.7 | 228.4 |
| 13 | Heilongjiang | 64 | 1,433,629 | -23.8 | 57.9 |
| 14 | Sichuan | 647 | 1,233,360 | -68.2 | 548.1 |
| 15 | Henan | 324 | 1,053,267 | 145.5 | 57.4 |
| 16 | Xinjiang | 113 | 1,051,771 | -79 | -9.6 |
| 17 | Chongqing | 2,726 | 721,602 | 68050 | 1429.5 |
| 18 | Hubei | 85 | 710,117 | 129.7 | -67.1 |
| 19 | Jiangxi | 431 | 520,587 | 1336.7 | 243.5 |
| 20 | Inner Mongolia | 128 | 351,958 | -24.3 | 75.8 |
Guangdong, Jiangsu, Shanghai and Zhejiang are the main export source of Chinese packaging machinery, the exports value in this four provinces accounted for 99.75% of total Chinese packaging machinery from Jan. to Aug. in 2012, the exports value of this four Cities/Provinces increased in different degrees, and the largest increase was in Jiangsu, increased 56.8% year-on-year. It is worth noting that the export quantity fell in Jiangsu and Shanghai, and Shanghai's packaging machinery exports quantity fell as much as 20.8%.


