Note:
| HS Code | Product Name |
| 9205 | Wind musical instruments, other than fairground organs and mechanical street organs, the following article hereinafter referred to as "wind instrument". |
China Wind Instrument Export Volume and Value from Jan. to October in 2013
| Month | Volume (Set) | Value (USD) | Compared to the Same Period of Last Year | |
| Volume | Value | |||
| January | 1,644,605 | 15,227,645 | -7.5% | 6.1% |
| February | 1,139,763 | 12,482,163 | 63.4% | 60.3% |
| March | 1,169,073 | 9,631,257 | -34.2% | -31.4% |
| April | 1,787,546 | 17,185,987 | 13.7% | 9.5% |
| May | 1,874,443 | 18,163,198 | -6.7% | 1.4% |
| June | 1,651,652 | 16,847,538 | -3.1% | -9.6% |
| July | 1,971,297 | 17,381,444 | 27.9% | 6.2% |
| August | 2,151,031 | 18,411,588 | 37.2% | -2.8% |
| September | 1,422,428 | 14,666,809 | -32.4% | -18.8% |
| October | 1,305,478 | 13,087,729 | -42.8% | -5% |
| Jan. to October Total | 16,117,316 | 153,085,358 | -5.4% | -1.6% |
The export volume of China wind instrument from Jan. to October in 2013 amounted to 16.117 million sets, with a decrease of 5.4%, while the export value amounted to 153 million US dollars, with a decrease of 1.6%.
China Wind Instrument Major Export Countries/Regions Distribution from Jan. to October in 2013
| No. | Countries | Volume (Set) | Value (USD) | Compared to the Same Period of Last Year | |
| Volume | Value | ||||
| 1 | USA | 3,605,915 | 47,053,104 | -11.4% | -7.7% |
| 2 | Germany | 787,791 | 14,789,658 | -22.2% | -3% |
| 3 | Brazil | 428,739 | 11,199,144 | 14.4% | -3.3% |
| 4 | UK | 245,750 | 6,445,596 | -36.3% | -11.1% |
| 5 | Japan | 779,206 | 6,227,993 | 6.2% | -1.2% |
| 6 | South Korea | 397,664 | 4,596,504 | -19.7% | 8% |
| 7 | Mexico | 692,322 | 4,093,760 | -20.4% | -28.1% |
| 8 | Canada | 195,263 | 4,065,343 | -12.3% | 8.6% |
| 9 | Chile | 325,403 | 3,762,625 | -24.9% | 6% |
| 10 | France | 234,291 | 3,645,658 | -17% | -8.2% |
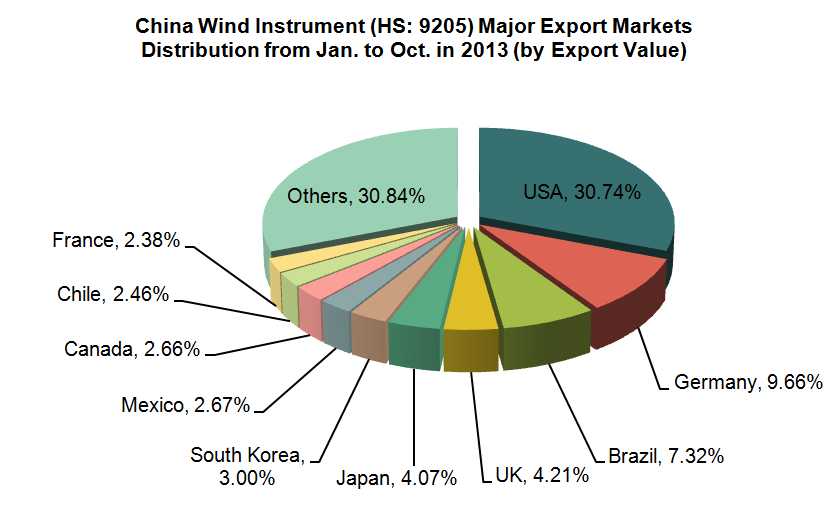
China's main export markets of wind instrument were the United States, Germany, Brazil, the UK and Japan from Jan. to October in 2013. The export value to the five countries accounted for 30.74%, 9.66%, 7.32%, 4.21% and 4.07% of our country's total export value of the product respectively and totally accounted for 55.99%.
China Wind Instrument Export Source Areas from Jan. to October in 2013
| No. | Regions | Volume (Set) | Value (USD) | Compared to the Same Period of Last Year | |
| Volume | Value | ||||
| 1 | Tianjin | 1,196,707 | 59,589,440 | -16.8% | -12.5% |
| 2 | Jiangsu | 4,677,320 | 26,835,271 | -7.3% | 12.2% |
| 3 | Shanghai | 1,898,885 | 25,360,704 | -2.2% | 1.4% |
| 4 | Hebei | 239,955 | 12,413,204 | 17.1% | 13.5% |
| 5 | Zhejiang | 5,684,523 | 9,511,055 | -9.1% | 3.1% |
| 6 | Beijing | 68,368 | 9,414,912 | -48.5% | 23.8% |
| 7 | Guangdong | 939,315 | 3,863,334 | -8.4% | -8.8% |
| 8 | Shandong | 535,906 | 3,824,932 | -21.9% | -13% |
| 9 | Hubei | 21,379 | 417,532 | -7.4% | 102.3% |
| 10 | Heilongjiang | 320,702 | 354,954 | 322.2% | 399.1% |
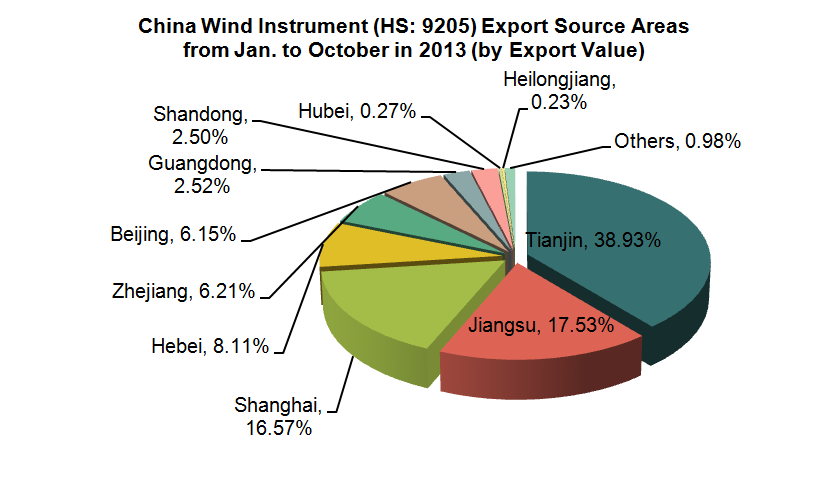
Tianjin, Jiangsu and Shanghai are our country's wind instrument major export source areas. From Jan. to October in 2013, the export value of the above three areas totally accounted for 73.02% of the total export value of the product. Among the top ten our country's export source areas of wind instrument, the export volume and value of Heilongjiang increased the largest rate. The export volume increased by 322.2% year on year, while the export value increased by 399.1% year on year.
(Source:China Customs Network)


