Global Packaging Machinery (HS: 842230) Annual Import Value from 2009 to 2011
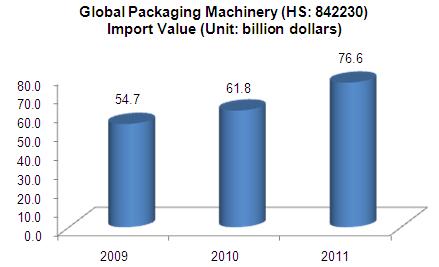
The total imports value grew year by year from 2009 to 2011; the imports value was 7.66 billion dollars in 2011, a growth of 23.9% year-on-year.
Major Importers of Global Packaging Machinery (HS: 842230) from 2009 to 2011
| No. | Importers | Imports Value(hundred million) | The growth of imports value in 2011 compared with 2009 | ||
| 2009 | 2010 | 2011 | |||
| 1 | USA | 6.50 | 7.26 | 9.86 | 51.7% |
| 2 | China | 3.76 | 8.63 | 9.21 | 144.9% |
| 3 | Russian Federation | 2.93 | 2.59 | 3.91 | 33.5% |
| 4 | France | 1.93 | 2.01 | 2.68 | 38.6% |
| 5 | Brazil | 1.50 | 2.13 | 2.61 | 74.2% |
| 6 | Mexico | 2.14 | 1.91 | 2.42 | 13.1% |
| 7 | Germany | 1.46 | 1.29 | 1.97 | 34.7% |
| 8 | Canada | 1.53 | 1.49 | 1.92 | 25.5% |
| 9 | Thailand | 1.02 | 1.33 | 1.88 | 83.7% |
| 10 | India | 1.22 | 1.12 | 1.74 | 42.1% |
| 11 | Britain | 1.06 | 1.37 | 1.71 | 61.1% |
| 12 | Italy | 1.23 | 1.63 | 1.47 | 20.0% |
| 13 | Saudi Arabia | 0.16 | 0.85 | 1.31 | 729.0% |
| 14 | Turkey | 0.50 | 0.80 | 1.28 | 156.9% |
| 15 | Vietnam | 0.67 | 0.83 | 1.25 | 87.6% |
| 16 | Hongkong | 0.37 | 0.42 | 1.19 | 220.0% |
| 17 | Spain | 1.12 | 1.05 | 1.15 | 2.5% |
| 18 | Australia | 0.66 | 0.96 | 1.11 | 67.8% |
| 19 | South Africa | 0.55 | 0.70 | 1.06 | 92.3% |
| 20 | Nigeria | 0.86 | 0.47 | 0.98 | 14.1% |
The USA is the world's largest importing country of packaging machinery, in 2011 the imports value was approximately 986 million dollars, an increase of 35.82% year-on-year. China and the Russian Federation ranked second and third, and the imports value in 2011 increased by 6.67% and 51.02% respectively. Saudi Arabia's packaging machinery imports value increased 729%,which had the largest increase in 2011 compared with 2009 among the top 20 global packaging machinery importers from 2009 to 2011.
Market Share of Major Global Packaging Machinery Importers (HS: 842230) from 2009 to 2011
| No. | Importers | Market Share | ||
| 2009 | 2010 | 2011 | ||
| 1 | USA | 11.88% | 11.75% | 12.88% |
| 2 | China | 6.87% | 13.96% | 12.03% |
| 3 | Russian Federation | 5.35% | 4.18% | 5.10% |
| 4 | France | 3.53% | 3.25% | 3.50% |
| 5 | Brazil | 2.73% | 3.44% | 3.41% |
| 6 | Mexico | 3.90% | 3.09% | 3.16% |
| 7 | Germany | 2.67% | 2.09% | 2.57% |
| 8 | Canada | 2.80% | 2.40% | 2.51% |
| 9 | Thailand↑ | 1.87% | 2.15% | 2.45% |
| 10 | India | 2.23% | 1.81% | 2.27% |
| 11 | Britain↑ | 1.94% | 2.21% | 2.23% |
| 12 | Italy | 2.24% | 2.64% | 1.92% |
| 13 | Saudi Arabia↑ | 0.29% | 1.38% | 1.71% |
| 14 | Turkey↑ | 0.91% | 1.29% | 1.67% |
| 15 | Vietnam↑ | 1.22% | 1.34% | 1.63% |
| 16 | Hongkong | 0.68% | 0.68% | 1.55% |
| 17 | Spanish↓ | 2.04% | 1.70% | 1.50% |
| 18 | Australia | 1.21% | 1.55% | 1.45% |
| 19 | South Africa↑ | 1.01% | 1.13% | 1.39% |
| 20 | Nigeria | 1.57% | 0.76% | 1.28% |
Note:"↑"represents the global imports accounted for the proportion of total imports continued to increase from 2009 to 2011, "↓"represent the imports accounted for the proportion of total global imports declining from 2009 to 2011.
From the market share for the 3 years, the imports value of Thailand, the United Kingdom, Saudi Arabia, Turkey, Vietnam and South Africa all continued increasing, while Spanish continued declining.
Major Exporters of Global Packaging Machinery (HS: 842230) from 2009 to 2011
| No. | Exporters | Export Value(hundred million) | The growth of imports value in 2011 compared with 2009 | ||
| 2009 | 2010 | 2011 | |||
| 1 | Germany | 23.01 | 19.86 | 21.75 | -5.46% |
| 2 | Italy | 12.28 | 14.52 | 16.21 | 31.99% |
| 3 | China | 2.43 | 3.26 | 3.98 | 63.36% |
| 4 | USA | 3.48 | 3.49 | 3.84 | 10.47% |
| 5 | Japan | 2.00 | 2.26 | 2.79 | 39.66% |
| 6 | France | 1.98 | 2.43 | 2.46 | 24.44% |
| 7 | Sweden | 1.56 | 1.71 | 2.29 | 46.67% |
| 8 | Switzerland | 1.26 | 1.34 | 2.01 | 58.87% |
| 9 | Holland | 1.73 | 1.76 | 1.53 | -11.54% |
| 10 | Canada | 1.03 | 1.05 | 1.45 | 41.11% |
| 11 | Austria | 0.94 | 1.13 | 1.37 | 45.58% |
| 12 | Taiwan | 0.99 | 1.23 | 1.27 | 28.90% |
| 13 | Britain | 1.16 | 1.26 | 1.24 | 6.94% |
| 14 | Hongkong | 0.42 | 0.42 | 0.99 | 136.28% |
| 15 | Spain | 0.84 | 0.83 | 0.95 | 12.89% |
| 16 | Denmark | 0.71 | 0.68 | 0.73 | 2.57% |
| 17 | Belgium | 0.57 | 0.45 | 0.63 | 10.41% |
| 18 | Republic of Korea | 0.36 | 0.61 | 0.59 | 62.76% |
| 19 | India | 0.45 | 0.44 | 0.54 | 20.06% |
| 20 | Israel | 0.12 | 0.33 | 0.48 | 291.32% |
Germany is the world's largest exporter of packaging machinery, the exports value of packaging machinery in Germany in 2011 accounted for 30.34% of the world's total exports. Among the top 20 packaging machinery exporters from 2009 to 2011, Israel had the largest growth in exports value in 2011 compared with 2009, increased 291.32%.
The Market Share of Major Global Packaging Machinery Exporters (HS: 842230) from 2009 to 2011
| No. | Exporters | Market Share | ||
| 2009 | 2010 | 2011 | ||
| 1 | Germany↓ | 37.67% | 31.27% | 30.34% |
| 2 | Italy | 20.11% | 22.87% | 22.61% |
| 3 | China↑ | 3.99% | 5.14% | 5.55% |
| 4 | USA↓ | 5.69% | 5.49% | 5.36% |
| 5 | Japan↑ | 3.28% | 3.56% | 3.90% |
| 6 | France | 3.24% | 3.83% | 3.43% |
| 7 | Sweden↑ | 2.56% | 2.69% | 3.20% |
| 8 | Switzerland↑ | 2.07% | 2.11% | 2.80% |
| 9 | Holland↓ | 2.84% | 2.77% | 2.14% |
| 10 | Canada | 1.68% | 1.65% | 2.02% |
| 11 | Austria↑ | 1.54% | 1.77% | 1.91% |
| 12 | Taiwan | 1.61% | 1.94% | 1.77% |
| 13 | Britain | 1.90% | 1.98% | 1.73% |
| 14 | Hongkong | 0.68% | 0.66% | 1.38% |
| 15 | Spain | 1.37% | 1.31% | 1.32% |
| 16 | Denmark↓ | 1.17% | 1.07% | 1.02% |
| 17 | Belgium | 0.93% | 0.71% | 0.87% |
| 18 | Republic of Korea | 0.59% | 0.95% | 0.82% |
| 19 | India | 0.74% | 0.70% | 0.76% |
| 20 | Israel↑ | 0.20% | 0.52% | 0.67% |
Note: "↑"represents the exports value of total global exports continued to increase from 2009 to 2011,"↓"represents the exports value of total global exports continued to decline from 2009 to 2011.
From the market share for the 3 years, the exports value of Japan, Sweden, Switzerland, Austria and Israel increased continuously, while in Germany, the USA, the Netherlands and Denmark, the exports value declined continuously.
Main Demanding Countries' Imports Situation of Packaging Machinery (HS: 842230) from 2009 to 2012
Packaging Machinery (HS: 842230) Imports Situation in the USA
Packaging Machinery Imports Trend in the USA from 2009 to 2012
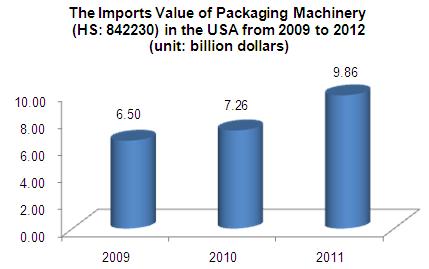
The packaging machinery imports value in the USA increased year by year from 2009 to 2011, the total imports was about 986 million dollars in 2011, an increase of 35.82% compared with the last year.
The USA Packaging Machinery (HS: 842230) Main Imports Countries / Regions from 2009 to 2011
| Countries / Regions | Total Imports Value from Jan. to Jul.(billion dollars) | Year-on-Year | Share |
| Total | 622,693 | 29.00% | 100.00% |
| Germany | 184,427 | 25.23% | 29.62% |
| Italy | 101,752 | 20.01% | 16.34% |
| Canada | 67,964 | 22.98% | 10.91% |
| Japan | 54,497 | 29.80% | 8.75% |
| France | 53,207 | 362.31% | 8.54% |
| China | 43,907 | 5.08% | 7.05% |
| Spain | 16,942 | 85.20% | 2.72% |
| Holland | 15,791 | 17.32% | 2.54% |
| Britain | 13,552 | 93.79% | 2.18% |
| Switzerland | 13,440 | -24.19% | 2.16% |
The imports value of packaging machinery in the USA reached 623 million dollars from Jan. to Jul., an increase of 29% compared with the previous year. Germany and Italy were the main imports supply countries of such products, shared 29.62% and 16.34% of the total imports respectively, China ranked sixth, accounting for 7.05% of the market share. It is noteworthy that the first seven months in 2012, the imports of the USA from France increased to 362.31%, significantly higher than the increase of imports in other countries.
Packaging Machinery (HS: 842230) Imports Situation in the France
Packaging Machinery Imports Trend in France from 2009 to 2011
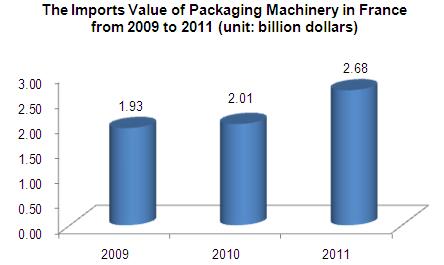
The imports value of packaging machinery in France showed the trend of increase from 2009 to 2011, the imports value was 2.68 billion dollars, increased 33.24% compared with the last year.
The France Packaging Machinery (HS: 842230) Main Imports Countries / Regions from 2009 to 2011
| Countries / Regions | Total Imports Value from Jan. to Jul.(thousand dollars) | Year-on-Year | Share |
| Total | 152,694 | 13.13% | 100.00% |
| Italy | 59,499 | 13.52% | 38.97% |
| Germany | 33,456 | -29.88% | 21.91% |
| Holland | 19,074 | 335.18% | 12.49% |
| Belgium | 15,394 | 432.30% | 10.08% |
| Switzerland | 4,645 | 23.93% | 3.04% |
| Israel | 4,587 | 615.60% | 3.00% |
| Sweden | 4,476 | 57.05% | 2.93% |
| Spain | 4,105 | 12.53% | 2.69% |
| The Republic of Czech | 2,055 | 57.35% | 1.35% |
| USA | 1,308 | -63.04% | 0.86% |
Italy is the largest packaging machinery exporter for France, accounting for 38.97% of the total France packaging machinery imports. It is noteworthy that the first seven months in 2012 the France packaging machinery imports value from the Netherlands, Belgium and Israel up to 335.18%, 432.30% and 615.60% respectively, significantly higher than those from other countries.
Packaging Machinery (HS: 842230) Imports Situation in Japan
Packaging Machinery Imports Trend in Japan from 2009 to 2011
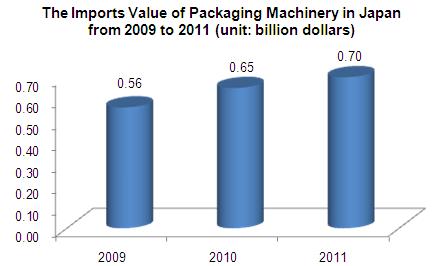
The imports value of packaging machinery in Japan showed the trend of increase from 2009 to 2011, the imports value was 70 million dollars, increased by 7.06% compared with the previous year.
The Japan Packaging Machinery (HS: 842230) Main Imports Countries / Regions from 2009 to 2011
| Countries / Regions | Total Imports Value from Jan. to Jul.(thousand dollars) | Year-on-Year | Share |
| Total | 52,351 | 44.50% | 100.00% |
| Germany | 14,432 | 86.92% | 27.57% |
| Italy | 6,782 | -36.71% | 12.95% |
| China | 5,916 | 82.42% | 11.30% |
| Sweden | 4,746 | 17.19% | 9.07% |
| France | 4,281 | 806.99% | 8.18% |
| Israel | 4,199 | / | 8.02% |
| Republic of Korea | 3,976 | 51.01% | 7.59% |
| Taiwan | 3,632 | 72.54% | 6.94% |
| USA | 1,599 | 7.82% | 3.05% |
| Vietnam | 1,097 | -14.36% | 2.10% |
Germany is the largest packaging machinery exporter for Japan, accounting for 27.57% of total Japan packaging machinery imports value, China ranked third, accounted for 11.30% of the total market share. It is noteworthy that the first seven months in 2012, the imports from France increased by 806.99% year-on-year, significantly higher than the other countries.


