2010-2012 USA Computer Import Value Annual Trend
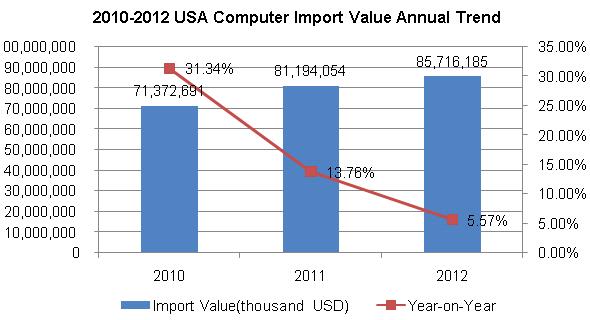
2010-2012 annual growth of total USA. Imports of computers, the growth rate decreased year by year, which is consistent with the trend of China's annual exports of the product.
2010-2012 USA Computer Major Import Market Trend Analysis
| No. | Countries/Regions | Import Value (USD) | Growth Compared 2012 to 2010 | ||
| 2010 | 2011 | 2012 | |||
|
| Total↑ | 71,372,691 | 81,194,054 | 85,716,185 | 5.57% |
| 1 | China↑ | 45,108,979 | 54,201,529 | 55,963,198 | 24.06% |
| 2 | Mexico↑ | 12,591,934 | 13,787,420 | 15,325,021 | 21.71% |
| 3 | Thailand | 3,156,119 | 2,899,243 | 4,289,576 | 35.91% |
| 4 | Taiwan | 998,043 | 1,817,531 | 1,592,551 | 59.57% |
| 5 | Malaysia↓ | 2,208,865 | 1,643,940 | 1,547,458 | -29.94% |
| 6 | Singapore | 2,217,800 | 1,376,452 | 1,385,140 | -37.54% |
| 7 | South Korea↑ | 568,359 | 974,361 | 1,228,610 | 116.17% |
| 8 | Japan↓ | 1,196,718 | 1,023,621 | 961,791 | -19.63% |
| 9 | Philippines | 485,219 | 482,844 | 656,009 | 35.20% |
| 10 | Hungary↑ | 509,415 | 538,281 | 540,827 | 6.17% |
| 11 | Canada↓ | 679,843 | 601,664 | 389,064 | -42.77% |
| 12 | Germany | 327,822 | 369,125 | 354,887 | 8.26% |
| 13 | UK↑ | 231,471 | 255,925 | 256,502 | 10.81% |
| 14 | Israel↓ | 209,719 | 204,864 | 194,863 | -7.08% |
| 15 | Vietnam↑ | 21,007 | 30,603 | 144,758 | 589.09% |
| 16 | Hong Kong | 68,125 | 150,887 | 118,049 | 73.28% |
| 17 | Indonesia↓ | 119,941 | 99,891 | 87,192 | -27.30% |
| 18 | France | 72,342 | 84,072 | 73,881 | 2.13% |
| 19 | Netherlands↑ | 50,738 | 60,401 | 72,777 | 43.44% |
| 20 | Italy | 71,015 | 65,843 | 66,098 | -6.92% |
Notice: “↑” indicate the continued rise during 2010-2012, “↓”indicate the continued decline during 2010--2012
2010-2012, China is the USA largest computer importer. In 2012 imports amounted to approximately $ 55.96 billion, with an increase of 24.06% compared with 2011. Mexico and Thailand were ranked second and third respectively. In the top 20 world's largest computer exporting country / region, Vietnam’s growth is the fastest in 2012 compared with 2010, with the increase of 589.09%.
2010-2012 China, Mexico, Korea, Hungary, British, Vietnam and Netherlands there countries computers export to USA. is increased year by year. The imports from Malaysia, Japan, Canada, and Israel are decreased year by year.
2010-2012 USA Major Import Market Share Trend Analysis
| No. | Countries/Regions | Import Value Percentage | ||
| 2010 | 2011 | 2012 | ||
| 1 | China | 63.20% | 66.76% | 65.29% |
| 2 | Mexico | 17.64% | 16.98% | 17.88% |
| 3 | Thailand | 4.42% | 3.57% | 5.00% |
| 4 | Taiwan | 1.40% | 2.24% | 1.86% |
| 5 | Malaysia↓ | 3.09% | 2.02% | 1.81% |
| 6 | Singapore↓ | 3.11% | 1.70% | 1.62% |
| 7 | South Korea↑ | 0.80% | 1.20% | 1.43% |
| 8 | Japan↓ | 1.68% | 1.26% | 1.12% |
| 9 | Philippines | 0.68% | 0.59% | 0.77% |
| 10 | Hungary↓ | 0.71% | 0.66% | 0.63% |
| 11 | Canada↓ | 0.95% | 0.74% | 0.45% |
| 12 | Germany↓ | 0.46% | 0.45% | 0.41% |
| 13 | UK↓ | 0.32% | 0.32% | 0.30% |
| 14 | Israel↓ | 0.29% | 0.25% | 0.23% |
| 15 | Vietnam↑ | 0.03% | 0.04% | 0.17% |
| 16 | Hong Kong | 0.10% | 0.19% | 0.14% |
| 17 | Indonesia↓ | 0.17% | 0.12% | 0.10% |
| 18 | France | 0.10% | 0.10% | 0.09% |
| 19 | Netherlands↑ | 0.07% | 0.07% | 0.08% |
| 20 | Italy↓ | 0.10% | 0.08% | 0.08% |
Notice: “↑”indicate the continued rise during 2010-2012, “↓”indicate the continued decline during 2010--2012
USA import computer products from China, which accounted for 60% of total. 2010-2012, in USA’s top 20 importer, the market share is increased year by year (China, Korea, Vietnam & Netherlands). On the contrary, Malaysia, Singapore, Japan, Hungary, Canada, British, Israel, Indonesia and Italy is decrease year by year.
2013 USA Computer Import Stand
USA Computer Major Import Market (2013 Jan. - May)
| Countries/Regions | Total Import Value from Jan. to May in 2013 (Thousand USD) | Year on Year | Percentage |
| Total | 32,170,116 | -5.87% | 100% |
| China | 21,009,970 | -2.57% | 65.31% |
| Mexico | 5,489,413 | -18.43% | 17.06% |
| Thailand | 1,829,417 | 8.02% | 5.69% |
| Taiwan | 589,395 | -5.90% | 1.83% |
| Malaysia | 553,411 | -19.31% | 1.72% |
| South Korea | 430,785 | -7.18% | 1.34% |
| Singapore | 429,857 | -33.60% | 1.34% |
| Japan | 352,811 | -9.04% | 1.10% |
| Vietnam | 265,556 | 1241.19% | 0.83% |
| Philippines | 219,653 | -29.83% | 0.68% |
2013 January to May, China was the United States, the main sources of imports of computer products, the United States 65.31% share of the market. USA 10 major sources of imports to, the first five months of 2013 the amount of imports of computer products from Vietnam surged 1241.19% over the same period in 2012, 15 in 2012 by a bit of jump up to the first nine, 2010-2012 United States from Vietnam the amount of imported computer products also major sources of imports growth rate to the fastest.


