China's Bidets, Lavatory Pans, Flushing Cisterns & Similar Plastic Sanitary Ware (hereafter called Plastic Sanitary Ware) Export Volume and Value
| Month | Volume(kg) | Value(kg) | Y-o-Y | |
| Volume | Value | |||
| January | 2,482,705 | 15,079,101 | -15.90% | -2.90% |
| February | 2,183,613 | 14,529,904 | 75.60% | 131.20% |
| March | 1,411,425 | 8,444,886 | -31.40% | -21.60% |
| April | 2,192,670 | 11,814,552 | -15.80% | -10% |
| May | 2,433,749 | 14,672,352 | -9.90% | -1.10% |
| June | 2,449,046 | 14,149,607 | 2.60% | 12.30% |
| July | 2,175,326 | 12,396,762 | -8.10% | -6.40% |
| August | 2,237,372 | 13,837,687 | -14.90% | -7.90% |
| September | 2,171,949 | 11,933,784 | 0.90% | -1.10% |
| October | 2,090,987 | 12,411,130 | -8.40% | 1.90% |
| November | 2,051,678 | 11,325,801 | -10.20% | -9.40% |
| December | 2,146,704 | 12,248,819 | -11% | -13.40% |
| Total | 26,027,224 | 152,844,385 | -7.30% | 0.40% |
From January to December in 2015, China's plastic sanitary ware export value volume was 26000 tons, down 7.3% and export volume was USD 153,000,000, up 0.4%.
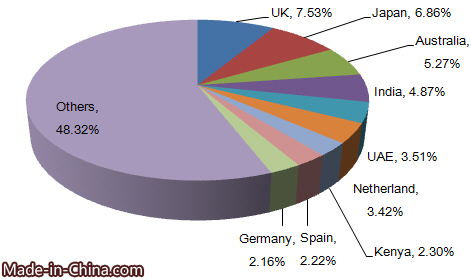
Major Countries for China's Plastic Sanitary Ware Export
| No. | Country | Volume(kg) | Value(USD) | Y-o-Y | |
| Volume | Value | ||||
| 1 | The United States | 3,223,553 | 20,694,076 | -1.50% | 4.20% |
| 2 | The United Kingdom | 1,706,104 | 11,509,754 | -13.20% | -14.30% |
| 3 | Japan | 2,817,160 | 10,486,298 | 1.90% | 1.30% |
| 4 | Australia | 1,078,752 | 8,050,069 | 6.10% | 16% |
| 5 | India | 940,390 | 7,449,208 | 3.40% | 35% |
| 6 | United Arab Emirates | 1,005,287 | 5,369,905 | -6.60% | 16.20% |
| 7 | Netherland | 1,084,680 | 5,225,651 | -26.10% | -34.90% |
| 8 | Kenya | 746,795 | 3,512,128 | 45.60% | 35.10% |
| 9 | Spain | 627,649 | 3,397,693 | 4% | -13.40% |
| 10 | Germany | 527,359 | 3,301,887 | 20.70% | 45% |

From January to December in 2015, the United States, the United Kingdom and Japan were top 3 export markets for China's sanitary ware export. Others markets included Australia, India, UAE, Netherland, Kenya and Spain.
China's Export Origins of Plastic Sanitary Wares
| No. | Provinces | Volume(kg) | Value(USD) | Y-o-Y | |
| Volume | Value | ||||
| 1 | Guangdong | 10,716,956 | 64,284,286 | -1.50% | 3.50% |
| 2 | Zhejiang | 6,564,155 | 36,779,074 | -8.40% | 17.90% |
| 3 | Fujian | 3,254,078 | 20,316,904 | -15.70% | -16.70% |
| 4 | Shanghai | 1,944,738 | 12,554,120 | 24.20% | 14.50% |
| 5 | Hebei | 1,207,186 | 5,850,385 | -27.90% | -33.20% |
| 6 | Jiangsu | 1,020,948 | 5,632,828 | -12.40% | 4.90% |
| 7 | Shandong | 867,229 | 4,536,547 | -1.30% | -3.30% |
| 8 | Beijing | 67,946 | 467,188 | -22.30% | -29.70% |
| 9 | Jiangxi | 60,663 | 422,768 | 29.60% | 141.70% |
| 10 | Xinjiang | 61,396 | 367,359 | -86.50% | -81.40% |
From January to December in 2015, China's main export origins of plastic sanitary ware were Guangdong, Zhejiang and Fujian. Guangdong's export volume accounted for 41.18% of total and export value accounted for 42.06%.


