During 1-9 of 2013, China Machinery (Machinery for Filling, Closing, Sealing, Capsuling or Labelling Bottles) Export Value & Volume and Mainly Import Country (Ranked by Export Value)
| No. | Country/Region | 1-9Total | Compared with the same period of last year | ||
|
|
| Volume(Unit) | Value(USD) | Volume | Value |
| 1 | Veitnam | 20,080 | 57,104,372 | -51.4% | 218.9% |
| 2 | USA | 991,072 | 41,113,530 | 12.6% | 30.1% |
| 3 | Indonesia | 66,024 | 21,216,609 | 23.5% | 8.7% |
| 4 | Russia | 20,718 | 17,585,057 | -62.0% | 78.3% |
| 5 | Thailand | 23,098 | 16,459,697 | 19.6% | -6.2% |
| 6 | India | 24,513 | 15,998,906 | 20.5% | -31.9% |
| 7 | Pakistan | 15,439 | 13,394,556 | -20.4% | 99.8% |
| 8 | Malaysia | 84,951 | 11,984,823 | -59.5% | 1.5% |
| 9 | Nigiria | 31,341 | 11,039,455 | -20.7% | -11.3% |
| 10 | Algeria | 4,616 | 9,863,556 | -48.4% | -21.9% |
| 11 | Bangladesh | 20,092 | 8,916,923 | 15.1% | 84.9% |
| 12 | Sourth Africa | 17,815 | 7,962,215 | -24.0% | 21.1% |
| 13 | Australia | 25,232 | 7,233,761 | -33.4% | 49.7% |
| 14 | Brazil | 10,779 | 6,603,264 | 5.9% | 11.0% |
| 15 | Canada | 71,918 | 6,532,153 | 18.2% | 55.2% |
| 16 | Japan | 97,750 | 6,498,603 | 54.3% | -28.0% |
| 17 | Egypt | 10,864 | 6,397,694 | -72.4% | 1.7% |
| 18 | Saudi Arabia | 5,197 | 6,119,884 | -27.6% | 20.6% |
| 19 | Taiwan | 20,056 | 5,895,351 | 89.1% | 111.0% |
| 20 | HK | 6,677 | 5,547,394 | -75.7% | -36.5% |
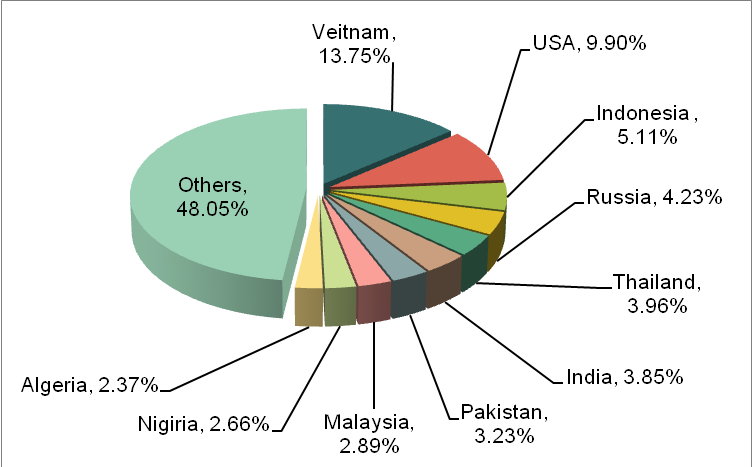
During 1-9 of 2013, the mainly export countries of China machinery (Machinery for Filling, Closing, Sealing, Capsuling or Labelling Bottles) are veitnam, USA, Indonesia, Russia, Thailand, India, Pakistan, Malaysia, Nigiria and Algeria. As the biggest export market, the export value took 13.75% of whole value. During three seasons of 2013, the export volume has dropped 51.4%, but the value increased 218.9%. During TOP 20 export markets, the export value to Pakistan and Taiwan also growed fast except veitnam, which increased 99.8% and 111.0% growth rate.
During 1-9 of 2013, China Machinery (Other Packing or Wrapping Beverages) (HS: 842240) Export Value & Volume and Mainly Import Country (Ranked by Export Value)
| No. | Country/Region | Total | Compared with the same periof of last year | ||
|
|
| Volume(Unit) | Value(USD) | Volume | Value |
| 1 | USA | 329,113 | 22,176,824 | 13.7% | 11.2% |
| 2 | Indonesia | 116,651 | 18,091,444 | -1.4% | 26.9% |
| 3 | Japan | 124,612 | 16,706,008 | 44.5% | 13.5% |
| 4 | HK | 6,885 | 13,717,993 | -40.8% | 115.2% |
| 5 | Malaysia | 91,315 | 13,241,691 | -2.8% | 37.6% |
| 6 | India | 33,222 | 12,492,638 | -22.2% | 22.1% |
| 7 | Bangladesh | 3,970 | 11,303,276 | -62.0% | 176.8% |
| 8 | Brazil | 11,888 | 9,951,018 | -83.3% | -27.8% |
| 9 | Thailand | 24,917 | 9,214,528 | -14.1% | -21.0% |
| 10 | Russia | 20,974 | 7,986,311 | -28.3% | -15.3% |
| 11 | Veitnam | 7,556 | 7,919,765 | -84.2% | -36.1% |
| 12 | Sourth Africa | 11,625 | 6,138,973 | -22.8% | 70.2% |
| 13 | Nigiria | 8,381 | 5,643,843 | -5.6% | 19.2% |
| 14 | Korea | 9,707 | 5,449,212 | 3.1% | 4.6% |
| 15 | Netherland | 110,563 | 4,863,003 | 20.3% | -5.1% |
| 16 | Australia | 42,181 | 4,453,972 | -6.8% | -24.3% |
| 17 | Philippines | 17,341 | 4,162,350 | -36.6% | 26.2% |
| 18 | UAE | 26,623 | 4,143,148 | -23.6% | 9.0% |
| 19 | UK | 15,099 | 4,067,877 | 3.9% | -12.0% |
| 20 | Turkey | 19,045 | 3,802,252 | 85.1% | 43.0% |
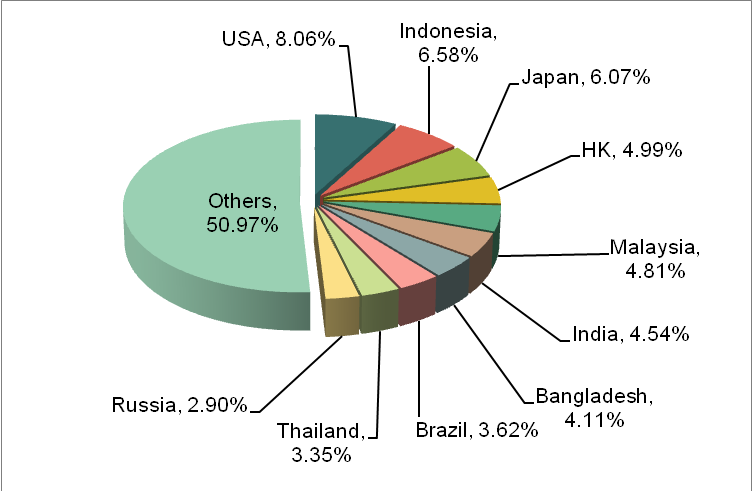
During 1-9 of 2013, the mainly export countries of China machinery (Other Packing or Wrapping Beverages) are USA, Indonesia, Japan, HK, Malaysia, India, Bangladesh, Brazil, Thailand and Russia. As the biggest export market, the export value to USA took 8.06% of whole value. During the first three seasons of 2013, the export value to HK and Bangladesh also took a fast growth, which increased 115.2% and 176.8% growth rate.
During 1-9 of 2013, China Machinery (Parts of Dish Washing Machines and Machinery) (HS: 842290) Export Value & Volume and Mainly Import Country (Ranked by Export Value)
| No. | Country/Region | 1-9 Total | Compared with the same period of last year | ||
| Volume(Kg) | Value(USD) | Volume | Value | ||
| 1 | Japan | 2,751,797 | 26,848,129 | 10.4% | -13.5% |
| 2 | USA | 3,550,353 | 26,345,838 | -23.8% | -8.0% |
| 3 | HK | 437,689 | 9,544,839 | 14.9% | 27.7% |
| 4 | Germany | 225,565 | 7,301,656 | 20.4% | 127.4% |
| 5 | Italy | 366,782 | 6,656,418 | -7.0% | -6.0% |
| 6 | Iran | 1,231,679 | 5,887,208 | 371.8% | 379.6% |
| 7 | France | 305,928 | 5,011,816 | -18.1% | -28.0% |
| 8 | Korea | 605,993 | 4,852,248 | -16.7% | -10.5% |
| 9 | Sweden | 98,762 | 4,406,156 | -16.5% | -0.7% |
| 10 | Thailand | 320,045 | 4,399,305 | 8.3% | 22.0% |
| 11 | Indonesia | 164,055 | 3,137,954 | 252.9% | 114.3% |
| 12 | Malaysia | 167,385 | 2,745,936 | 122.5% | 65.5% |
| 13 | Austra | 78,955 | 2,558,659 | 6.8% | 0.4% |
| 14 | India | 178,207 | 2,282,104 | 39.8% | 87.8% |
| 15 | Egypt | 396,141 | 1,881,335 | -55.7% | -53.4% |
| 16 | Veitnam | 82,746 | 1,846,377 | 32.7% | 12.9% |
| 17 | Irasel | 112,784 | 1,786,391 | 1199.7% | 119.0% |
| 18 | Taiwan | 99,377 | 1,758,693 | -23.4% | 8.8% |
| 19 | UK | 104,592 | 1,687,424 | 13.1% | -1.7% |
| 20 | Netherland | 97,909 | 1,677,563 | 27.9% | 64.7% |
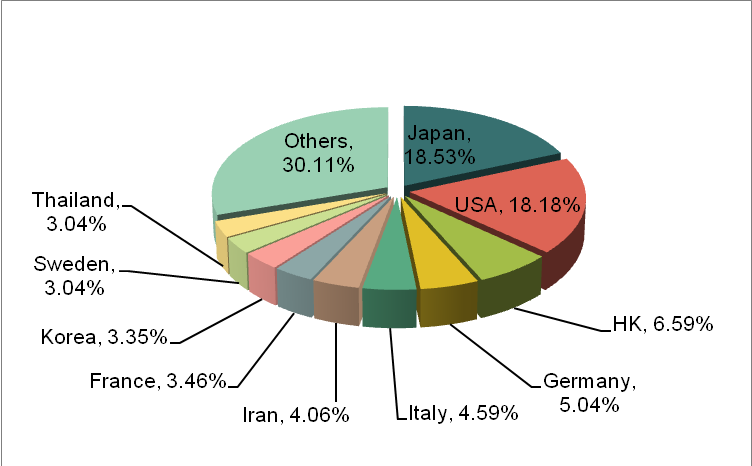
During 1-9 of 2013, the mainly export countries of China machinery (Parts of Dish Washing Machines and Machinery) are Japan,USA, HK, Germany, Italy, Iran, France, Korea, Sweden and Thailand. As the biggest export markets, the export value to Japan & USA took 18.53% and 18.18% of whole value. During the first three seasons of 2013, the export value to Germany, Iran, Indonesia and Irasel also took a fast growth, which increased 127.4%, 114.3% and 119% growth rate.
Data Source: China Custom

